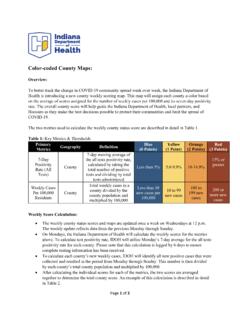
Color-coded County Maps - Indiana
(3 Points) 7-Day Positivity Rate (All Tests) County 7-day moving average of the all tests positivity rate, calculated by taking the total number of positive tests and dividing by total tests administered Less than 5% 5.0-9.9% 10-14.9% 15% or greater Weekly Cases Per 100,000 Residents County Total weekly cases in a county divided by the
Download Color-coded County Maps - Indiana

Information
Domain:
Source:
Link to this page:
Documents from same domain
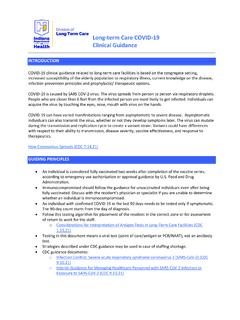
Long-term Care COVID-19 Clinical Guidance
www.coronavirus.in.govRefer to COVID-19 LTC Infection Control Guidance . Refer to Symptomatic Individuals and Known COVID-19 sections of this guidance if symptoms occur or the resident tests positive for COVID-19. • Unvaccinated staff with exposure to COVID-19 …

What are variants? Why are variants important?
www.coronavirus.in.govWhat are variants? Variants are different strains of a virus, such as SARS-CoV-2 (the virus that causes COVID-19), that arise as a virus mutates or changes. Viruses naturally mutate as they multiply to make more virus particles, and new variants are expected over time. Some variants will die out. Other variants may
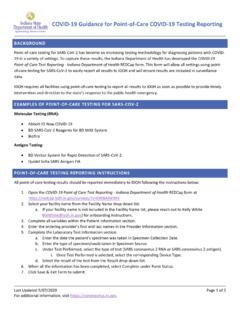
COVID-19 Guidance for Point-of-Care COVID-19 Testing …
www.coronavirus.in.govSep 07, 2020 · COVID-19 Guidance for Point-of-Care COVID-19 Testing Reporting Last Updated 9/07/2020 Page 1 of 2 For additional information, visit https://coronavirus.in.gov. BACKGROUND Point-of-care testing for SARS-CoV-2 has become an increasing testing methodology for diagnosing patients with COVID-19 in a variety of settings.
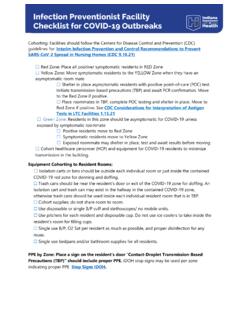
Infection Preventionist Facility Checklist for COVID-19 ...
www.coronavirus.in.govChecklist for COVID-19 Outbreaks Cohorting: Facilities should follow the Centers for Disease Control and Prevention (CDC) guidelines for: Interim Infection Prevention and Control Recommendations to Prevent SARS-CoV-2 Spread in Nursing Homes (CDC 9.10.21) ☐ Red Zone: Place all positive/ symptomatic residents in RED Zone
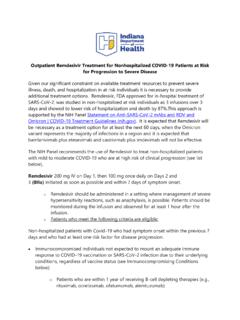
Outpatient Remdesivir Treatment for Nonhospitalized COVID ...
www.coronavirus.in.govJan 03, 2022 · Outpatient Remdesivir Treatment for Nonhospitalized COVID-19 Patients at Risk for Progression to Severe Disease Given our significant constraint on available treatment resources to prevent severe illness, death, and hospitalization in at risk individuals it is necessary to provide additional treatment options.

COVID-19
www.coronavirus.in.govisolation period, the individual must wear a mask when around others for an additional 5 days. Before discontinuing isolation, an individual must be at least 24 hours fever-free without fever-reducing medications and having symptoms improve. (5) Except as provided below, asymptomatic individuals who are identified as a close contact of a
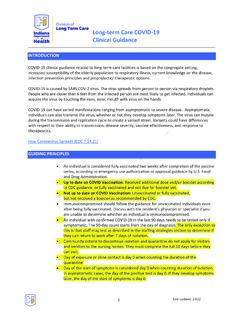
Long-term Care COVID-19 Clinical Guidance
www.coronavirus.in.govFeb 08, 2022 · Long-term Care COVID-19 Clinical Guidance Last updated: 2.8.22 4 residents could be removed from TBP after 7 days if asymptomatic and had a negative viral test within 48 hours prior to removal from TBP. Refer to COVID-19 LTC Infection Control Guidance . Refer to Symptomatic Individuals and Known COVID-19 sections of this guidance if
Related documents

New York State Next Generation English Language Arts ...
www.nysed.govStandard 3: Evaluate a speaker’s point of view, reasoning, and use of evidence and rhetoric. Presentation of Knowledge and Ideas. Standard 4: Present information, findings, and supporting evidence so that listeners can follow the line of reasoning. Ensure that the organization, development, and style are appropriate to task, purpose, and ...

Email Etiquette for Students - University Academic Success ...
tutoring.asu.eduMy name is Jane Lee and I am in your MW MAT117 9am-10am class. I am emailing in regards to assignment #5. I have a couple of questions about some of the topics. may I come by during your office hours at 10am tomorrow to discuss these questions? If another time would be better for you, please let me know and I will reschedule.
Medicare Benefit Policy Manual - Centers for Medicare ...
www.cms.gov3. Hemofiltration - Hemofiltration is an alternative to peritoneal dialysis and hemodialysis. Hemofiltration (which is also known as diafiltration) removes fluid, electrolytes, and other low molecular weight toxic substances from the blood by filtration through hollow artificial membranes and may be routinely performed in three weekly sessions.

Chapter 1. The Basics of Workers’ Compensation
www.dir.ca.gov1. Name of your employer 2. A statement that if you are hurt on the job, you designate your personal physician to provide medical care. Give the name, address, and phone number of your physician. 3. Your name 4. Your signature 5. Date You can predesignate a doctor of medicine (MD) or doctor of osteopathy (DO) who treated you in the

2022 Publication 15-A - IRS tax forms
www.irs.gov3. The electronic submission must be signed with an electronic signature by the payee whose name is on the form. The electronic signature must be the final entry in the submission. 4. Upon request, you must furnish a hard copy of any completed electronic form to the IRS and a statement that, to the best of the payer's knowledge, the elec-

FORM TC201 INSTRUCTIONS FOR 2022/23 - New York City
www1.nyc.govForm TC201 Part 3. Report monthly rent due on the December 2021 or January 2022 rent roll. Your application may be denied review if youdivide residential income reported in Part 6 by 12 to calculate monthly rent in Part 3 instead of stating an actual month’s rent roll or if you report 12 times the monthly rent roll instead of the actual annual