Data Analysis Basics: Variables and Distribution
The data we are trying to code has an inherent order, but the coding in this example does not follow that order. This is not appropriate coding for an ordinal categorical vari-able. For a nominal categorical variable, however, the order makes no difference. Although we code each category with a number, the number does not represent a numeri-cal ...
Download Data Analysis Basics: Variables and Distribution

Information
Domain:
Source:
Link to this page:
Documents from same domain
Case-Control Studies for Outbreak Investigations
nciph.sph.unc.edu“In August 2001, a cluster of Ralstonia pickettii bac-teremia occurred among neonatal intensive care unit (NICU) infants at a California hospital….A case-control study was conducted to identify risk factors for infec-tion….Controls were NICU infants who: (1) had blood cultures taken during either cluster period (July 30-
The Community Resiliency Model - UNC Gillings School of ...
nciph.sph.unc.edu•Trauma informed •Resiliency focused •Strengths based •Can be used by school staff for self‐care •Can support the development of healthy community climate/ culture •Can be used for prevention and intervention •Biologically‐grounded, non‐ stigmatizing •Can be taught to and by all
Enfoque en Epidemiología de Campo Niveles de bioseguridad ...
nciph.sph.unc.edutas de laboratorio, guantes de látex, y protección para los ojos o máscaras para el rostro, según sea necesario dependiendo del tipo de trabajo que se realice). Se requiere un lavamanos para lavarse las manos. No se requieren estructuras adicionales para laboratorios BSL-1 Otras Precauciones Las precauciones de bioseguridad también son

Epidemic Curves Ahead - UNC Gillings School of Global ...
nciph.sph.unc.eduVOLUME 1, ISSUE 5 spectively. Three days back from the peak case (the 11th) would be the 8th of the month. Counting 1 day back from the first case would also be the 8th. Thus, the hypothe-sized exposure date is the 8th of the month. Since this technique is not precise, the exposure period should be
Introduction to Public Health Surveillance
nciph.sph.unc.edu• Monitoring obesity, physical activity, and other fac-tors that are important indicators for chronic dis-eases such as diabetes. How to Conduct Surveillance Surveillance data allow the description and comparison of patterns of disease by person, place, and time. There are several ways to describe and compare these pat-
Related documents
Linear Regression Analysis for Survey Data
faculty.nps.eduLinear Regression Analysis for Survey Data Professor Ron Fricker Naval Postgraduate School Monterey, California 1. ... • Likert scale data is categorical (ordinal) ... designed for complex survey analysis 18. Population vs. Sample • Sometimes have a census of data: can
CHAPTER 5 EXAMPLES: CONFIRMATORY FACTOR …
www.statmodel.comand ordered categorical (ordinal) outcomes, multiple group analysis is specified by using the GROUPING option of the VARIABLE command for individual data or the NGROUPS option of the DATA command for summary data. For censored with maximum likelihood estimation, unordered categorical (nominal), and count outcomes, multiple group
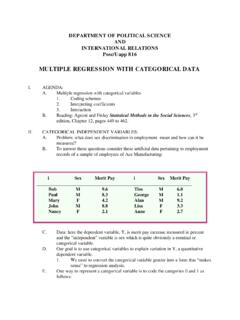
MULTIPLE REGRESSION WITH CATEGORICAL DATA
www1.udel.educategorical variable. D. Our goal is to use categorical variables to explain variation in Y, a quantitative dependent variable. 1. We need to convert the categorical variable gender into a form that “makes sense” to regression analysis. E. One way to represent a categorical variable is to code the categories 0 and 1 as follows:

The 7 Steps of Data Analysis - StatsWhisperer
www.statswhisperer.comMoreover, this book does not only describe the process of data analysis, but applies it. Specifically, The 7 Steps of Data Analysis model is applied to complete two data analysis studies for two reasons. First, these studies are presented to illustrate the many steps, decisions, and challenges encountered when conducing a data analysis study.
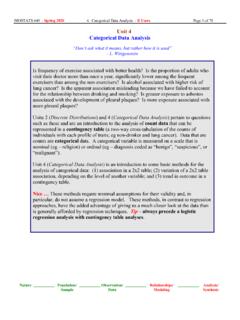
Unit 4 Categorical Data Analysis - UMass
people.umass.eduData that are counts are categorical data. A categorical variable is measured on a scale that is nominal (eg – religion) or ordinal (eg – diagnosis coded as “benign”, “suspicious”, or “malignant”). Unit 4 (Categorical Data Analysis) is an introduction to some basic methods for the
An Introduction to Categorical Data Analysis
xn--webducation-dbb.com12 A Historical Tour of Categorical Data Analysis * 325 Appendix: Software for Categorical Data Analysis 331 A.1 R for Categorical Data Analysis 331 A.2 SAS for Categorical Data Analysis 332 A.3 Stata for Categorical Data Analysis 342 A.4 SPSS for Categorical Data Analysis 346 Brief Solutions to Odd-Numbered Exercises 349 Bibliography 363 ...

BCS Level 4 Diploma in Data Analysis Concepts QAN …
www.bcs.orgdata analysis. Objectives Learners should be able to demonstrate knowledge and understanding of Data Analysis and its underlying architecture, principles, and techniques. Key areas are: 1. Explore the different types of data, including open and public data, administrative data, and research data 2. Understand the data lifecycle 3.
Exploratory Data Analysis for Feature Selection in Machine ...
services.google.comRigorous data analysis, focusing on the relationship between features or between features and labels, with rigorous reasoning (theory) Descriptive analysis of each attribute in a dataset for numerical, categorical, and textual attributes Correlation analysis of two attributes (numerical versus numerical,