DECISION ANALYSIS Chapter 4 - swlearning.com
Risk Analysis Sensitivity Analysis 4.5 DECISION ANALYSIS WITH SAMPLE INFORMATION An Influence Diagram A Decision Tree Decision Strategy Risk Profile Expected Value of Sample Information Efficiency of Sample Information 4.6 COMPUTING BRANCH PROBABILITIES Decision analysis can be used to determine an optimal strategy when a de-
Download DECISION ANALYSIS Chapter 4 - swlearning.com

Information
Domain:
Source:
Link to this page:
Documents from same domain
WHAT IS ECONOMICS? - Cengage Learning
www.swlearning.comThomson Lear ning™ E conomics. The word conjures up all sorts of images: manic stock traders on Wall Street, an economic summit meeting in a European capital, a somber
89782 03 c03 p073-122 - Cengage Learning
www.swlearning.comMultiple regression analysis is also useful for generalizing functional relationships between variables. As an example, suppose family consumption (cons) is a quadratic func-tion of family income (inc):cons b 0 b 1
Capital Budgeting: The Basics - Cengage Learning
www.swlearning.comChapter 11 Capital Budgeting: The Basics (1 + r)t Risk-Adjusted Cost of Capital (WACC) Project Free Cash Flows (FCF t) VALUE = N ∑ …

WORKSHOP Workplace Interaction - Cengage …
www.swlearning.comKnowing Your Place By not taking other people’s needs and opinions into account, Cara sounds like a know-it-all. Instead of lecturing staff members, demanding
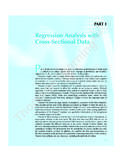
Regression Analysis with Cross-Sectional Data
www.swlearning.comPART 1 Regression Analysis with Cross-Sectional Data 23 P art 1 of the text covers regression analysis with cross-sectional data. It builds upon a solid base of college algebra and basic concepts in probability and statistics.

The External Environment - Cengage Learning
www.swlearning.comThe External Environment The Broad Environment Socio-cultural Forces Global Economic Forces Global Technological Forces Global Political/Legal Forces
Part One - Cengage Learning
www.swlearning.com1 Part One Chapter 1 Strategic Management and Strategic Competitiveness Chapter 2 The External Environment: Opportunities,Threats, Industry …

Chapter 2: The Managerial Functions - Cengage …
www.swlearning.comChapter 2: The Managerial Functions After studying this chapter,you will be able to: 1 Summarize the difficulties supervisors face in fulfilling managerial roles. 2 Explain why effective supervisors should have a variety of skills.
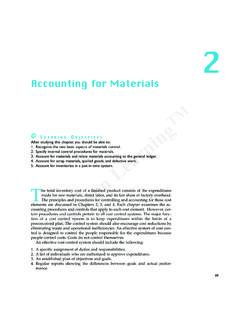
Accounting for Materials - Cengage Learning
www.swlearning.comning TM Chapter 2 Accounting for Materials 51 Segregation of Duties. A basic principle of internal control is the segregation of employee duties to minimize opportunities for misappropriation of assets.
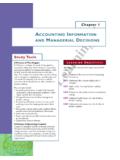
Chapter 1
www.swlearning.comThomson Learning™ Chapter 1 ACCOUNTING INFORMATION AND MANAGERIAL DECISIONS A Preview of This Chapter In Chapter 1, we begin the study of managerial ac-counting by discussing what is meant by accounting
Related documents

Profile Analysis - San Francisco State University
userwww.sfsu.eduProfile Analysis . Introduction . Profile analysis is the multivariate equivalent of repeated measures or mixed ANOVA. Profile analysis is most commonly used in two cases: 1) Comparing the same dependent variables between groups over several time-points. 2) When there are several measures of the same dependent variable (Ex.
Introduction to XRPD Data Analysis
prism.mit.edu– Analysis of the second derivative of diffraction data is used to identify likely diffraction peaks – Peak information is extracted by fitting a parabola around a minimum in the second derivative – This method is fast but the peak information lacks precision • Profile fitting – Each diffraction peak is fit independently with an equation

Success Profile Matrices - GOV.UK
assets.publishing.service.gov.ukHR Success Profile Guide Matrices | 9 EO HEO/SEO Grade 6/7 HR Deputy Director Pay and Reward Data analysis and applying numerical skills Digital proficiency Using communication and interpersonal skills to deliver key projects Digital proficiency Using data and evidence to make decisions and influence Building and managing relationships and ...
Factor Analysis - Harvard University
cdn1.sph.harvard.eduWhat is factor analysis ! Factor analysis is a theory driven statistical data reduction technique used to explain covariance among observed random variables in terms of fewer unobserved random variables named factors 4
Country classification - United Nations
www.un.orgCountry classification Data sources, country classifications and aggregation methodology The statistical annex contains a set of data that the World Economic Situation and …