
Excel 2016 - Charts
category headings and the body of the data or Excel will plot the blank spaces. Navigate to the Insert tab, Charts group, and select a chart type from the Ribbon. You will see several options for chart types, and then options for each chart type. You are able to preview the charts by clicking on a chart type, and highlighting over the options .
Download Excel 2016 - Charts

Information
Domain:
Source:
Link to this page:
Documents from same domain
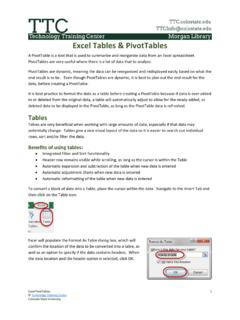
Excel Tables & PivotTables
wsnet2.colostate.eduAny time the cursor is within the table data, the Table Tools Design Tab will be displayed on the right side of the ribbon. To make any changes to a table, ...
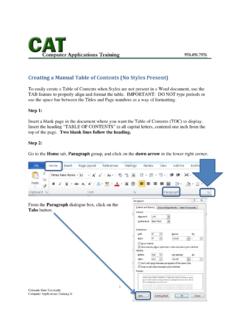
a Manual Table of Contents (No Styles Present)
wsnet2.colostate.eduCreating a Manual Table of Contents (No Styles Present) To easily create a Table of Contents when Styles are not present in a Word document, use the TAB feature to properly align and format the table.

FALL 2022 | SPRING 2023
wsnet2.colostate.edu• The total of all aid offered and additional resources cannot exceed your estimated 2022-2023 educational expenses for attending CSU. Important Notes 10 COLLEGE MONEYMANAGEMENT TIPS Apply for federal financial aid for free at www.fafsa.gov. Budget your costs and resources so you can borrow as little loan as possible.
Related documents

Solving Differential Equations Using Simulink
people.uncw.eduJul 01, 2019 · plot after using the autoscale ( ) feature to rescale the scope view. A little effort is needed to change the plot attributes and to import the plots into working documents. This will be discussed in Section 1.4. •Also, one can make further changes to the system by checking the Con-figuration Parameters under the Simulation menu item. See ...
Linear Programming Lecture Notes
www.personal.psu.edu1.1 Goat pen with unknown side lengths. The objective is to identify the values of xand ythat maximize the area of the pen (and thus the number of goats that can be kept).2 1.2 Plot with Level Sets Projected on the Graph of z. The level sets existing in R2 while the graph of zexisting R3. The level sets have been projected onto their
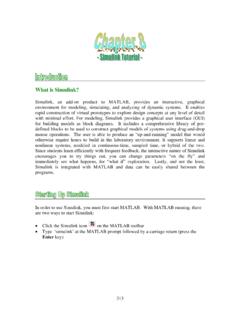
What is Simulink?
ewh.ieee.org1v. Close the dialog box. • Double-click the Gain block. Change the gain to 5 and close the dialog box. Copying blocks: • Position the pointer on the block to be copied, press the right mouse button down and keep it pressed down to copy the block. Drag the copy of the desired position and release the mouse button.
MathCAD Tutorial
www.engr.colostate.educ. Plot the graph, name and find point on the graph d. Variables and units - Handle real, imaginary, and complex numbers with or without associated units. e. Set the matrices and vectors - Manipulate arrays and perform various linear algebra operations, such as finding eigenvalues and eigenvectors, and looking up values in arrays. f.
GED Study Guide
www.ged.com1 Side lengths of shapes when given the area or perimenter Find the side lengths of triangles, rectangles, and polygons when given the area or perimeter. ... The Wilson family's back yard is a rectangular plot that has a length of 100 feet and a width of 80 feet. ... box plots, tables, scatter plots, and line graphs. Example Questions Graphical ...
Lab 9: Tensile Testing
www.mse.iastate.edu(5). A plot of Force (kN) versus Stroke (mm) will be generated in real-time during the experiment. 2.5 Finishing (1). The machine will stop automatically when the sample is broken. Click the icon “Export” and type a file name in the box (*.TXT). the
Chapter 15 Mixed Models - CMU Statistics
www.stat.cmu.eduThe plot shows all of the data points, with game score plotted against trial number. Smoothed lines are shown for each of ... up as many subjects with most or all of their outcomes on the same side of their group’s tted line. ... a main dialog box, and …

Affidavit of Consideration for Use By Seller
www.state.nj.us(See Instruction #8 on reverse side) Deponent states that this deed transaction is fully exempt from the Realty Transfer Fee imposed by 1968, c. 49 as amended through P.L. P.L. 2004, c. 66 for the following reason(s). Mere reference to exemption symbol is insufficient. Explain in detail. _____ (5) TIAL EXEMPTION FROM FEE. PAR ( Instruction #9 ...