Exercises
Finance: mean = 25, standard deviation = 2 Marketing: mean = 75, standard deviation = 12 Correlation between score in Finance and same student’s score in Marketing = 0.84 Mary, a student in Cluster Ψ, scored a 30 in Finance and a 90 in Marketing.We are interested in comparing her performance on the two exams relative to the rest of the
Download Exercises

Information
Domain:
Source:
Link to this page:
Documents from same domain
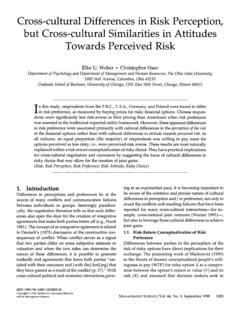
Cross-cultural Differences in Risk Perception, but …
www0.gsb.columbia.eduCross-cultural Differences in Risk Perception, but Cross-cultural Similarities in Attitudes Towards Perceived Risk Elke U. Weber * Christopher Hsee
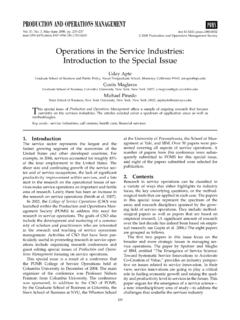
PRODUCTION AND OPERATIONS MANAGEMENT …
www0.gsb.columbia.eduApte,Maglaras,andPinedo: Operations in the Service Industries Production and Operations Management 17(3), pp. 235–237, ©2008 Production and Operations Management Society 237 limits of this special issue, the scope of the papers
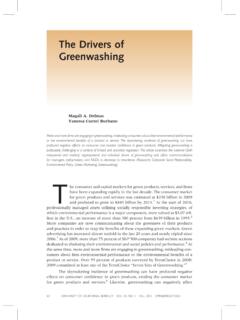
The Drivers of Greenwashing - Columbia Business School
www0.gsb.columbia.eduThe Drivers of Greenwashing Magali A. Delmas ... The skyrocketing incidence of greenwashing can have profound negative effects on consumer and investor confidence in green products. Mitigating greenwashing is ... Environmental Policy, Green Marketing, Greenwashing) T
An Explanation of Negative Swap Spreads
www0.gsb.columbia.eduswap rate (which is the xed-rate in the swap) of a 30-year interest rate swap (IRS) and the yield of a Treasury bond with the same maturity, commonly referred to as swap spread, dropped sharply and became negative.
Do CEOs Matter? - Columbia Business School
www0.gsb.columbia.eduDo CEOs Matter?* Morten Bennedsen Copenhagen Business School and CEBR Francisco Pérez-González Stanford GSB and NBER Daniel Wolfenzon Columbia GSB and NBER August 2008 Abstract. Estimating the value of top managerial talent is a central topic of research that has
“Do CEOs Matter?” - Columbia Business School
www0.gsb.columbia.edudo not randomly appoint or fire CEOs. As a result, attributing differences in performance to managers themselves, and not to industry and firm characteristics, is empirically difficult.
The Price of Diversi fiable Risk in Venture Capital and ...
www0.gsb.columbia.eduand venture capital funds have a value-weighted IRR of 19.31%, but these are commensurate with the factor risks that these investors bear (i.e., the alphas are insigni ficantly different from zero).
The Stationary Beer Game - Columbia Business School
www0.gsb.columbia.edu2 1. Introduction The beer game is an exercise that simulates the material and information flows in a production-distribution system. It has four players: retailer, wholesaler, distributor, and factory.

Financial Openness and Productivity
www0.gsb.columbia.eduFinancial Openness and Productivity GEERT BEKAERT Columbia University, New York, NY, USA ... of North Carolina, Chapel Hill, NC, USA Summary. — Financial openness is often associated with higher rates of economic growth. We show that the impact of openness on ... ment growth and/or factor productivity growth responses.

Principles for the Application of Fair Value Accounting
www0.gsb.columbia.eduPrinciples for the Application of Fair Value Accounting ... the paper then turns to the issue of measurement. Measurement is, of course, the rub of accounting and good concepts sometimes fall against the ... fair value measurement applies at the level of the assets and liabilities that work together as a combined business group. Thus, just as ...
Related documents
19: Sample Size, Precision, and Power
www.sjsu.eduwhere ∆ denotes the expected mean difference (or difference worth detecting), n denotes the per group sample size, and σ denotes the standard deviation of the variable (e.g., s, s d, s pooled, s w, etc., depending on your sampling scheme). Example: A study of 30 pairs expects a mean difference of 2. The standard deviation of the paired ...
Normal Distribution, Confidence Intervals for the Mean ...
webspace.ship.eduFor example: We have a sample that has a mean of 8 and a standard deviation of 2.53. What is the z-score of an observation from this data set that has a value of 13? Therefore, a value of 13 in this data set is 1.98 standard deviations from the mean. We can use the z-table to find out the probability of picking a number >= 13 from this data set.
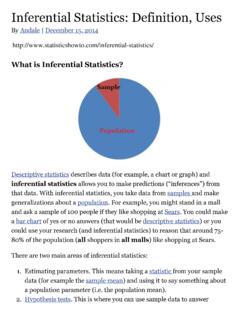
What is Inferential Statistics? - PSY 225: Research Methods
online225.psych.wisc.eduSample mean Sample standard deviation Making a bar chart or boxplot Describing the shape of the sample probability distribution. A bar graph is one way to summarize data in descriptive statistics. Source: NIH.GOV. With inferential statistics …

PARTICULATES NOT OTHERWISE REGULATED, RESPIRABLE 0600
www.cdc.govreplicates and record relative standard deviation (S r) on control charts. Take corrective action when the precision is out of control [8]. MEASUREMENT: 11. Weigh each filter, including field blanks. Record this post-sampling weight, W 2 (mg), beside its corresponding tare weight.

Student's t-distribution
www.eecs.yorku.caIn most such problems, if the standard deviation of the errors were known, a normal distribution would be used instead of the t-distribution. Confidence intervals and hypothesis tests are two statistical procedures in which the quantiles of the sampling distribution of a particular statistic (e.g. the standard score) are required.

CALCULATING STANDARD DEVIATION WORKSHEET
www.dvusd.orgFor the following sets of data, calculate the mean and standard deviation of the data. Describe the mean and standard deviation in words after calculating it. a. The data set below gives the prices (in dollars) of cordless phones at an electronics store. 35, 50, 60, 60, 75, 65, 80 b.
Standard Practice for Using Significant Digits in Test Data ...
www.galvanizeit.com3.1.3 repeatability standard deviation (s r), n—the standard deviation of test results obtained under repeatability conditions. E177 3.1.4 significant digit—any of the figures 0 through 9 that is used with its place value to denote a numerical quantity to some desired approximation, excepting all leading zeros and

Normal Distributions
www3.nd.eduThe standard Normal curve is the normal curve with mean = 0 and standard deviation ˙= 1. We will see later how probabilities for any normal curve can be recast as probabilities for the standard normal curve. For the standard normal, probabilities are computed either by means of a computer/calculator of via a table.