Transcription of Exercises
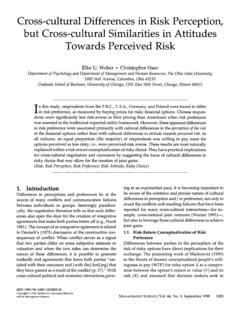
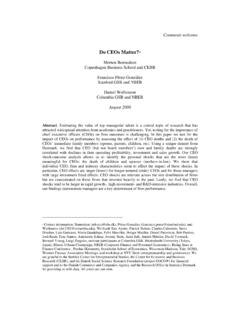
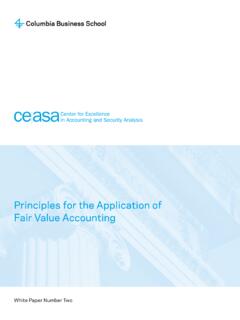
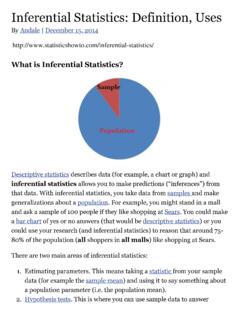
1 ExercisesFall 2001 Professor Paul GlassermanB6014: Managerial Statistics403 Uris Hall1. Descriptive Statistics2. Probability and Expected Value3. Covariance and Correlation4. Normal Distribution5. Sampling6. Confidence Intervals7. Hypothesis Testing8. Regression Analysis8 ExercisesDescriptive StatisticsFall 2001 Professor Paul GlassermanB6014: Managerial Statistics403 Uris Hall0 1 2 3 4 5 6 7 8 # Occurrences01234567 ValuesFigure 1: Histogram for Problem 11 .Find the median of the data in Figure 1 .2 .Find the standard deviation of the data in Figure 1 .3 .Five students from the 1999 MBA class took jobs in rocket science after graduation.
2 Fourof these students reported their starting salaries: $95,000, $106,000, $106,000, $118, fifth student did not report a starting salary .Choose one of the following:(a) The median starting salary for all five students could be anywhere between $95,000and $118,000.(b) The median starting salary for all five students is $106,000.(c) The median starting salary for all five students is $106,500.(d) The median starting salary for all five students could be greater than $118, .The observationsX1,..,Xnhave a mean of 52, a median of , and a standard deviationof 7 .Eight percent of the observation are greater than 66; 7 .9% of the observations arebelow 38.
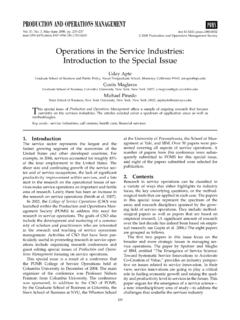
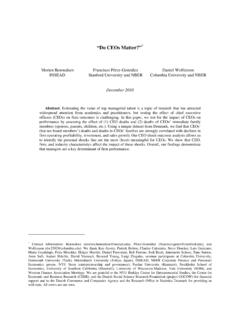
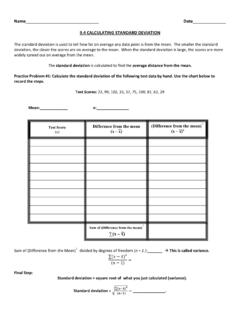
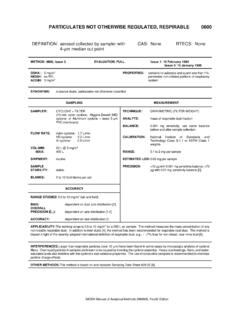
3 Based on this information, which of the following statementsbestdescribes thedata? 2: Scatter plot for question 5(i) The distribution has positive skew.(ii) The distribution has negative skew.(iii) The distribution has high kurtosis.(iv) The distribution conforms to a normal .Consider the data in the scatter plot of Figure 2 .The correlation between theXandYvalues in the figure is closest to(i) (ii) (iii) 1(iv) 1(v) 06 .The observationsX1,..,Xnhave a mean of 50 and a standard deviation of 7 .Which ofthe following statements is guaranteed to be true according to Chebyshev s rule? (Write True or False next to each.)
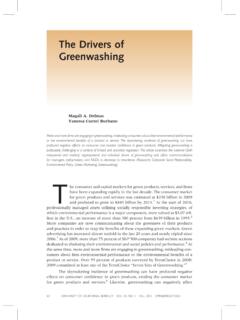
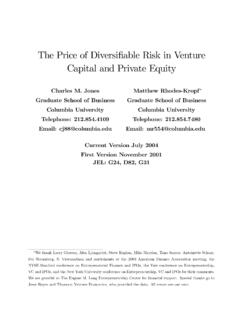
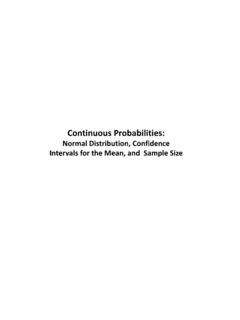
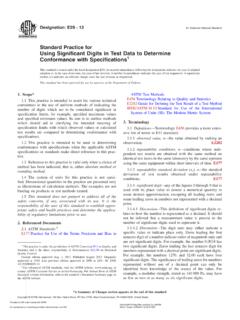
4 (i) At least 75% of the observations are between 36 and 64(ii) At least 80% of the observations are between 34 and 66(iii) At least of the observations are between 31 and 73(iv) Fewer than 15% of the observations are below 307 .Suppose the observationsX1,X2,..,Xnhave mean 10 .Suppose that exactly 75% of theobservations are less than or equal to 15 .According to Chebyshev s rule, what is thesmallest possible value of the population standard deviation of these observations? PriceFrequencyFigure 3: Histogram of bond prices at default, 1974-1995 .(Source: Moody s Investor Services .)8 .Which of the following best describes the data in Figure 3?
5 (Base your answer on theappearance of the histogram .You do not need to do any calculations .Select just onestatement below and complete the one you select.)(a) The mean is greater than the median because(b) The median is greater than the mean because(c) The mean and median are roughly equal because9 .One proposal that has received little attention from Major League Baseball is to paypitchers according to the following rule: each pitcher receives a base salary of $ million,minus$ million times his earned run average (ERA). (A lower ERA is associated withbetter performance.) If this rule were adopted, what would be the correlation between apitcher s earnings and ERA?
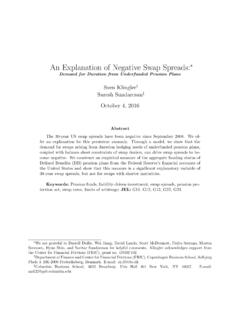
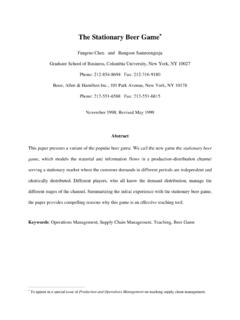
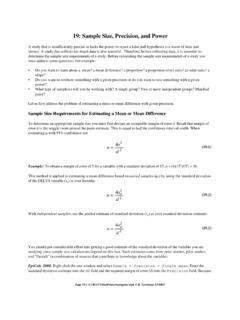
6 (Assume that the ERA cannot exceed 17, so this rule neverresults in negative earnings. You may also assume a standard deviation of for ERA.)10 .Using the data in Figure 4, answer both (a) and (b) below, providing a numerical valuefor each.(a) The mean of the data in the histogram is(b) The median of the data in the histogram is11 .Cluster had exams in Finance and Marketing last week .All 60 students in the clustertook both exams .The results were as follows: Finance: mean = 25, standard deviation = 2 Marketing: mean = 75, standard deviation = 12 Correlation between score in Finance and same student s score in Marketing = , a student in Cluster , scored a 30 in Finance and a 90 in Marketing.
7 We areinterested in comparing her performance on the two exams relative to the rest of theclass .In particular, we would like to make a statement about which of her scores rankedhigher compared to the other scores on the same exam .Selectoneof the choices belowand complete the statement you # observationsFigure 4: Histogram for Problem 10(i) Mary s score in Finance probably ranks higher than her score in Marketing because(ii) Mary s score in Marketing probably ranks higher than her score in Finance because(iii) Mary s scores on the two exams probably rank about equally high because(iv) We cannot make any comparison between the two scores because12.
8 Seven students from the 1998 MBA class took jobs in brain surgery after graduation .Fiveof the students reported their starting salaries: $55,000, $90,250, $90,250, $95,500, and$105,000 .Choose one of the following:(a) Based on the information given, the largest possible value of the median startingsalary for all seven students is(b) Based on the information given, it is not possible to put an upper limit on the medianstarting salary for all seven : Descriptive Statistics1 .There are 15 data points in the histogram .Seven are smaller than 3 and seven are greaterthan 3, so the median is .We show four different ways of calculating the standard deviation .
9 Method the full set of observations in a spreadsheet, repeating values asmany times as they occur: 0, 0, 0, 0, 1, 2, 2, 3, 4, 4, 4, 5, 5, 6, 7 .Apply the functionSTDEVP to the observations .The result is 2 .28 .(The function STDEV gives aslightly different answer because it calculates the sample standard deviation ratherthan the population standard deviation .)Method the full set of observations in a spreadsheet, as in the columnlabeled Xi in Table 1 .Calculate the average of these values; this gives 2 .867 .Now make a column of thesquaredobservations,X2i, as in the second column of thetable.
10 The average of the squared observations is 13 .4 .The variance is the differencebetween the average of the squared observations and the square of the average:(1nn i=1X2i) (1nn i=1Xi)2= ( )2= standard deviation is the square root, = (Xi X) 1: Solution to Problem 2 Method in Method 2, list the full set of observations and calculate their mean toget X= .For each observationXi,calculate(Xi X)2, the squared distance from13the mean; these values are in the third column of Table 1 .The average of these squareddifferences gives the variance1nn i=1(Xi X)2= standard deviation is the square root, = thedistinctvalues observed without repetition, as in the second columnof Table 2.