FEDERAL RESERVE statistical release
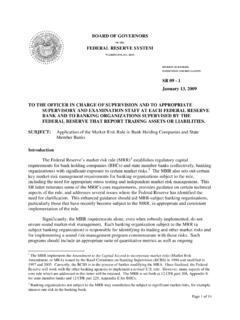
Apr 15, 2022 · Note: The shaded areas are periods of business recession as defined by the National Bureau of Economic Research (NBER). 1970 1975 1980 1985 1990 1995 2000 2005 2010 2015 2020 25 50 75 100 125 150 175 25 50 75 100 125 150 175 Capacity Production Total Manufacturing 1. Industrial production, capacity, and utilization Ratio scale, 2017 output = 100
Download FEDERAL RESERVE statistical release
Information
Domain:
Source:
Link to this page:
Documents from same domain
Office of the Comptroller of the Currency Board of ...
www.federalreserve.govOffice of the Comptroller of the Currency Board of Governors of the Federal Reserve System Federal Deposit Insurance Corporation Concentrations in Commercial Real Estate …
Guide to the Federal Reserve's Payment System …
www.federalreserve.govThis publication is available at http://www.federalreserve.gov/paymentsystems/psr_relpolicies.htm . Guide to the Federal Reserve’s . Payment System Risk Policy
Federal Reserve Policy on Payment System Risk
www.federalreserve.govFederal Reserve Policy on Payment System Risk As amended effective September 15, 2017 INTRODUCTION
Regulation D Reserve Requirements - Federal …
www.federalreserve.govRegulation D1 Reserve Requirements Background Regulation D imposes reserve requirements on certain deposits and other liabilities of depository institutions2 solely for the purpose of implementing
FOMC Policy on External Communications of …
www.federalreserve.govPREAMBLE1 In the course of making monetary policy decisions, the Federal Open Market Commit-tee (the “Committee”) makes extensive use of background materials prepared by the staff of

FEDERAL RESERVE statistical release
www.federalreserve.govFEDERAL RESERVE statistical release H.15 (519) SELECTED INTEREST RATES For use at 2:30 p.m. Eastern Time October 3, 2016 Discontinuance of several rates on October 11, 2016 Beginning October 11, 2016, the Federal Reserve Board will cease publication of the following interest rates on its Selected
The Fedwire Funds Service Assessment of …
www.federalreserve.govThe Fedwire ® Funds Service Assessment of Compliance with the Core Principles for Systemically Important Payment Systems . Revised July 2014
Right to Financial Privacy Act - Federal Reserve …
www.federalreserve.govRight to Financial Privacy Act Background The Right to Financial Privacy Act of 1978 was enacted to provide the financial records of financial
OF THE FEDERAL RESERVE SYSTEM
www.federalreserve.govpage 1 of 14 board of governors of the federal reserve system washington, d.c. 20551 division of banking supervision and regulation sr 09 - 1
Credit Risk Rating at Large U.S. Banks
www.federalreserve.govCredit Risk Rating at Large U.S. Banks William F. Treacy, of the Board’s Division of Banking Supervision and Regulation, and Mark S. Carey, of
Related documents

S&P 500 Forward Earnings & the Economy - Yardeni Research
www.yardeni.comNote: Shaded areas are recessions according to the National Bureau of Economic Research. Source: Standard & Poor’s until Q4-1993, then I/B/E/S data by Refinitiv. yardeni.com Figure 4. S&P 500 Forward & Operating Earnings Page 4 / May 1, 2022 / S&P 500 Forward Earnings & the Economy www.yardeni.com Yardeni Research, Inc.
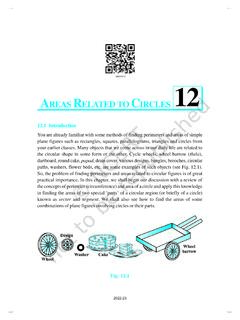
REAS RELATED TO CIRCLES - NCERT
ncert.nic.inin finding the areas of two special ‘parts’ of a circular region (or briefly of a circle) known as sector and segment. We shall also see how to find the areas of some ... Thus, in Fig. 12.4, shaded region OAPB is a sector of the circle with centre O. ∠ AOB is called the angle of the sector. Note that in this figure, unshaded region OAQB ...

S&P 500 Dividend & Earnings Yield - Yardeni Research
www.yardeni.comNote: Shaded red areas are S&P 500 bear market declines of 20% or more. Yellow areas are bull markets. Source: Standard & Poor’s and Bureau of Labor Statistics. yardeni.com Figure 3. 52 54 56 58 60 62 64 66 68 70 72 74 76 78 80 82 84 86 88 90 92 94 96 98 00 02 04 06 08 10 12 14 16 18 20 22 24 26-4-2 0 2 4 6 8 10 12 14-4-2 0 2 4 6 8 10 12
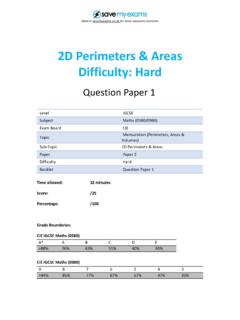
2D Perimeters Areas Difficulty: Hard
cdn.savemyexams.co.ukSub‐Topic 2D Perimeters & Areas Paper Paper 2 Difficulty Hard Booklet Question Paper 1. ... The shaded area is A cm. Showthat 22 4A = 4k –πk.[2] 22 (b) Make k the subject of the formula 4A = 4k –πk. [3] Question 5. Head to savemyexams.co.uk for more awesome resources 6