
Fitting distributions with R
with a different distribution. If data differ from a normal distribution (i.e. data belonging from a Weibull pdf) we can use qqplot()in this way (Fig. 5): x.wei<-rweibull(n=200,shape=2.1,scale=1.1) ## sampling from a Weibull distribution with parameters shape=2.1 and scale=1.1
Download Fitting distributions with R

Information
Domain:
Source:
Link to this page:
Documents from same domain

Package ‘segmented’ - R
cran.r-project.orgPackage ‘segmented’ November 30, 2017 Type Package Title Regression Models with Break-Points / Change-Points Estimation Version 0.5-3.0 Date 2017-11-22

gap: Genetic Analysis Package - R
cran.r-project.org2 gap: Genetic Analysis Package from patients su ering with di erent diseases to identify common genetic variations for each condition. It is hoped that by identifying these genetic signposts, researchers will

Package ‘season’ - R
cran.r-project.orgPackage ‘season’ May 20, 2018 Type Package Title Seasonal Analysis of Health Data Version 0.3.6 Author Adrian Barnett and Peter Baker Maintainer Adrian Barnett <a.barnett@qut.edu.au>

Package ‘medicalrisk’ - The Comprehensive R …
cran.r-project.orgPackage ‘medicalrisk’ ... 2016 Type Package Title Medical Risk and Comorbidity Tools for ICD-9-CM Data Version 1.2 Date 2016-01-23 Description Generates risk estimates and comorbidity flags from ICD-9-CM ... Adapting a clinical comorbidity index for use with ICD-9-CM administrative data: differing perspectives. Journal of clinical ...

Package ‘testthat’ - R
cran.r-project.orgPackage ‘testthat’ December 13, 2017 Title Unit Testing for R Version 2.0.0 Description Software testing is important, but, in part because it is

Package ‘forecast’ - The Comprehensive R Archive …
cran.r-project.orgPackage ‘forecast’ June 21, 2018 Version 8.4 Title Forecasting Functions for Time Series and Linear Models Description Methods and tools for displaying and analysing

Package ‘emma’ - R
cran.r-project.org2 emma-package Index 21 emma-package Designing experiments for process optimization Description The evolutionary model-based multiresponse approach (EMMA) is a procedure for process opti-

Package ‘WeibullR’ - cran.r-project.org
cran.r-project.orgPower" presentations in Appendix D of "The New Weibull Handbook, Fifth Edition". For validity of a 3rd parameter optimization on a given model over its 2 parameter fit, only the Likelihood Ratio Test will be applied. This validity check requires an LRT-P greater than 50 Value

Package ‘maps’ - R
cran.r-project.orgPackage ‘maps’ April 3, 2018 Title Draw Geographical Maps Version 3.3.0 Date 2018-04-03 Author Original S code by Richard A. Becker and Allan R. Wilks.

Package ‘psycho’ - The Comprehensive R Archive Network
cran.r-project.orgPackage ‘psycho’ September 13, 2018 Type Package Title Efficient and Publishing-Oriented Workflow for Psychological Science Version 0.3.7 Maintainer Dominique Makowski <dom.makowski@gmail.com>
Related documents

5.1 Survival Function
faculty.washington.eduNamely, in an exponential distribution, the hazard function is a constant and the cumulative hazard is just a linear function of time. Example 2 (Weibull distribution). The Weibull distribution is a distribution with two parameters, and k, and it is a distribution for positive random variable. Its PDF is p(t) = k( t)k 1 e ( t)k;t 0:

An Introduction to Extreme Value Statistics
grotjahn.ucdavis.edu1Note that the Weibull distribution has a nite right endpoint; Gumbel and Fr echet have in nite right endpoints 2The GP function can be approximated as the tail of a GEV; the scale parameter ˙u is a function of the threshold and is equivalent to ˙g + ˘(u ), where ˙g, ˘and are all parameters of a corresponding GEV distribution

Lecture 15 Introduction to Survival Analysis
www.stat.columbia.eduestimating survival functions. Sometimes, we may want to make more assumptions that allow us to model the data in more detail. By specifying a parametric form for S(t), we can • easily compute selected quantiles of the distribution • estimate the expected failure time • derive a concise equation and smooth function for estimating S(t), H ...

Probability Distributions Used in Reliability Engineering
crr.umd.eduevidence to assist in estimating the probability of an event. This is important in many reliability applicationswhere the event s of interest (e. g, system failure) are

Parametric Survival Models - Princeton University
data.princeton.eduThe log of the Weibull hazard is a linear function of log time with constant plog + logpand slope p 1. Thus, the hazard is rising if p>1, constant if p= 1, and declining if p<1. The Weibull is also related to the extreme-value distribution: T ˘ W( ;p) i Y = logT= + ˙W; where Whas the extreme value distribution, = log and p= 1=˙.
Chapter 2 The Maximum Likelihood Estimator
web.stat.tamu.eduExample 2.2.2 (Weibull with known ↵) {Y i} are iid random variables, which follow a Weibull distribution, which has the density ↵y↵1 ↵ exp( ↵(y/ ) ) ,↵>0. Suppose that ↵ is known, but is unknown. Our aim is to fine the MLE of . The log-likelihood is proportional to L n(X; )= Xn i=1 log↵ +(↵ 1)logY i ↵log Y i ↵
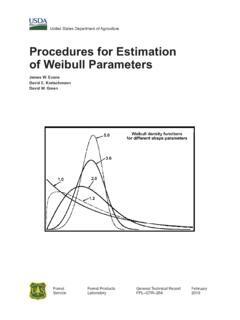
Procedures for estimation of Weibull parameters
www.fpl.fs.fed.usprocedures. The two-parameter Weibull distribution is the underlying basis of the calculations in load and resistance factor design (LRFD), a subset of RBD that is discussed in American Society for Testing and Materials (ASTM) D5457–04a (ASTM 2009). This design procedure starts with fitting a two-parameter Weibull distribution to either a

Semiconductor Reliability - ISSI
www.issi.com2.1 Methods for Estimating the Early Failure Rate Weibull distribution is applied to approximate the CDF of early failure period; it can exhibit a shape where the failure rate decreases over time. Weibull distribution is characterized by two important parameters, scale factor ( ) and shape factor ( ). They are defined as: ( ) 1 exp 1 R(t ) t