
Getting Started in Data Analysis using Stata
From SPSS/SAS to Stata Example of a dataset in Excel From Excel to Stata (copy-and-paste, *.csv) Describe and summarize Rename Variable labels Adding value labels Creating new variables (generate) Creating new variables from other variables (generate) Recoding variables (recode) Recoding variables using egen
Download Getting Started in Data Analysis using Stata

Information
Domain:
Source:
Link to this page:
Documents from same domain
Introduction to RStudio
dss.princeton.eduThe console is where you can type commands and see output The workspace tab shows all the active objects (see next slide). The history tab shows a list of commands used so far. The files tab shows all the files and folders in your default workspace as if you were on

Multiple Imputation of Missing Data Using Stata
dss.princeton.eduimputation model should always include all the variables in the analysis model, including the dependent variable of the analytic model as well as any other variables that may provide information about the probability of missigness, or about the true value of the missing data. Theory should guide the decision as to which variables to include.

Panel Data Analysis Fixed and Random Effects using Stata ...
dss.princeton.eduPU/DSS/OTR Fixed Effects using least squares dummy variable model (LSDV). 16 _cons 8.81e+08 9.62e+08 0.92 0.363 -1.04e+09 2.80e+09

Linear Regression using Stata - Princeton University
dss.princeton.edubetween X and Y. R-square shows the amount of variance of Y explained by X. In this case expenseexplains 22% of the variance in SAT scores. Lets run the regression: regress . csat expense, robust. Adj R. 2 (not shown here) shows the same as . R. 2. but adjusted by the # of cases and # of variables. When the # of variables is small and the # of ...

Data Preparation/Descriptive Statistics
dss.princeton.eduextensions are *.txt for tab-separated data and *.prn for space-separated data. Any statistical package can read these formats. •Record form (or fixed). Data is structured by fixed blocks (for example, var1 in columns 1 to 5, var2 in column 6 to 8, etc). You will need a codebook and to write a program (either in Stata, SPSS or SAS) to read ...
Notes on Exploring Data - Princeton University
dss.princeton.eduSPSS . SAS . Stata . JMP (SAS) R . Python (Pandas) Learning curve Gradual . Pretty steep Gradual . Gradual . Pretty steep Steep . User interface Point-and-click . Programming . Programming/ point-and-click . Point-and-click . Programming Programming Data manipulation Strong . Very strong Strong .
Related documents
INTRODUCTION TO SPSS - University of Manchester
research.bmh.manchester.ac.uk• Recent Files – Open a previously used dataset • What’s New – Learn about new features in SPSS 23.0 • Modules and Programmability – Links to help menus for advanced users • Tutorials – Beginners guides to features in SPSS 23.0 Click, the New Dataset within the New Files option, to get a blank SPSS …

Testing mediation using bootstrapping in SPSS
www.socialchangelab.netThe dataset can be accessed HERE Note the variable names that map onto the SPSS file Also recall the mediation conventions (from Baron and Kenny, 1986) Path a = IV to MedV Path b = MedV to DV, controlling for the IV (when multiplied together these are the INDIRECT effect) Path c = IV to DV (aka the TOTAL effect)

Logistic Regression on SPSS - The Center for Applied ...
case.truman.eduThe dataset is available at U:\_MT Student File Area\hjkim\STAT380\SPSS tutorial\hypertension.sav. Note that the hypertension variable binary variable. 0 means no hypertension and 1 means hypertension. Predictor variables are age, gender and body mass index. Age and bmi is quantitative and gender is categorical variable.
Data Analysis using SPSS - University of North Dakota
med.und.edu– Variable View – Data View SPSS gives a lot of information, most which you don’t need – Ignore what you don’t need 1. Start SPSS from wherever you have it 2. Double click New Dataset at the top left 3. In the box on the right there are 10 people’s names, type them into the first column 4. You may notice a problem when you get to Peter.

SPSS Statistics 19 Step by Step: Answers to Selected Exercises
wps.ablongman.comschools. Create a new variable in this dataset named , with values of 1 and 2. Create variable school labels, where 1 is the name of a school you like, and 2 is the name of a school you don’t like. Save your dataset with the name gradesme.sav. 3. Which of the following variable names will SPSS accept, and which will SPSS reject? For those that
SPSS Manual for Introductory Applied Statistics: A ...
www.gvsu.eduINTRODUCTION TO SPSS Figure 0.7: Variable types in the SPSS Data Editor - Variable View tab. 3.Column - Width By default SPSS uses 8 characters as the column width. You may change this by clicking in the column and typing in a new value or using the up/down arrow that appears. 4.Column - Decimals By default SPSS uses two decimal places for ...
SPSS Tutorial - Multivariate Solutions
www.mvsolution.com• Identifying new product opportunities. ... ki value of variable X k for case j Problems: • Different measures = different weights • Correlation between variables (double ... • Open it in SPSS. The supermarkets.sav dataset. Run Principal Components Analysis and save scores
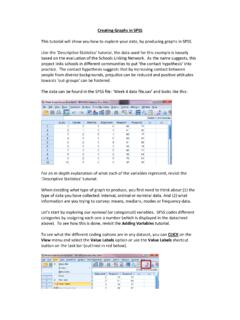
Creating Graphs in SPSS - Open University
www.open.ac.ukSPSS codes different categories by assigning each one a number (which is displayed in the datasheet above). To see how this is done, revisit the Adding Variables tutorial. To see what the different coding options are in any dataset, you can CLICK on the View menu and select the Value Labels option or use the Value Labels shortcut