
Getting Started in Data Analysis using Stata
From SPSS/SAS to Stata Example of a dataset in Excel From Excel to Stata (copy-and-paste, *.csv) Describe and summarize Rename Variable labels Adding value labels Creating new variables (generate) Creating new variables from other variables (generate) Recoding variables (recode) Recoding variables using egen
Download Getting Started in Data Analysis using Stata

Information
Domain:
Source:
Link to this page:
Documents from same domain
Introduction to RStudio
dss.princeton.eduThe console is where you can type commands and see output The workspace tab shows all the active objects (see next slide). The history tab shows a list of commands used so far. The files tab shows all the files and folders in your default workspace as if you were on

Multiple Imputation of Missing Data Using Stata
dss.princeton.eduimputation model should always include all the variables in the analysis model, including the dependent variable of the analytic model as well as any other variables that may provide information about the probability of missigness, or about the true value of the missing data. Theory should guide the decision as to which variables to include.

Panel Data Analysis Fixed and Random Effects using Stata ...
dss.princeton.eduPU/DSS/OTR Fixed Effects using least squares dummy variable model (LSDV). 16 _cons 8.81e+08 9.62e+08 0.92 0.363 -1.04e+09 2.80e+09

Linear Regression using Stata - Princeton University
dss.princeton.edubetween X and Y. R-square shows the amount of variance of Y explained by X. In this case expenseexplains 22% of the variance in SAT scores. Lets run the regression: regress . csat expense, robust. Adj R. 2 (not shown here) shows the same as . R. 2. but adjusted by the # of cases and # of variables. When the # of variables is small and the # of ...

Data Preparation/Descriptive Statistics
dss.princeton.eduextensions are *.txt for tab-separated data and *.prn for space-separated data. Any statistical package can read these formats. •Record form (or fixed). Data is structured by fixed blocks (for example, var1 in columns 1 to 5, var2 in column 6 to 8, etc). You will need a codebook and to write a program (either in Stata, SPSS or SAS) to read ...
Notes on Exploring Data - Princeton University
dss.princeton.eduSPSS . SAS . Stata . JMP (SAS) R . Python (Pandas) Learning curve Gradual . Pretty steep Gradual . Gradual . Pretty steep Steep . User interface Point-and-click . Programming . Programming/ point-and-click . Point-and-click . Programming Programming Data manipulation Strong . Very strong Strong .
Related documents

A BRIEF INTRODUCTION TO MULTIVARIATE ANALYSIS OF …
oak.ucc.nau.eduAs with ANOVA, the independent variables for a MANOVA are factors, and each factor has two or more levels. Unlike ANOVA, MANOVA includes multiple dependent variables rather than a single dependent variable. MANOVA evaluates whether the population means on a set of dependent variables vary across the levels of a factor or factors.

ANSWERS TO EXERCISES AND REVIEW QUESTIONS
spss.allenandunwin.com.s3-website-ap-southeast-2.amazonaws.comvariables. These can be used to check for out-of-range cases, to explore the distribution of the scores, and to describe your sample in the Method section of a report. 3.1 Use the instructions in Chapter 6 and Chapter 7 of the SPSS Survival Manual to answer the following questions concerning the variables included in the survey.sav data file.

Quantitative Data Analysis Using SPSS : an Introduction ...
knowledgegate.com.au2.3 Setting up an SPSS database 21 2.3.1 Defining the variables 22 2.3.2 Adding value labels 25 2.4 Entering the data 27 2.5 Exercises 28 2.6 Notes 31 3 Descriptive statistics: frequencies, measures of central tendency and illustrating the data using graphs 33 3.1 Frequencies 33 3.2 Measures of central tendency for interval variables 38
Creating Graphs in SPSS - Open University
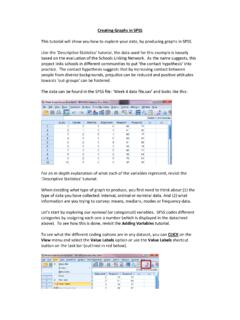
www.open.ac.ukThe data can be found in the SPSS file: Week 4 data file.sav and looks like this: For an in-depth explanation of what each of the variables represent, revisit the Descriptive Statistics tutorial. When deciding what type of graph to produce, you first need to think about (1) the type of data you have collected: interval, ordinal or nominal data.

Binary Logistic Regression - University of Nebraska–Lincoln
psych.unl.eduvariables. Specify the entry method -- here Enter means to add all variables to the model simultaneously. Both blockwise entry (adding all predictors in that block) and blockwise selection (selecting “best” at a time) are possible Move each categorical predictor into the “Categorical Covariates:” window.

A Student’s Guide to Interpreting SPSS Output for Basic ...
www.chapman.eduvariables. SPSS also gives the correlation between the two dependent variables, that was left off here for space. The difference between the average amount of support provided to mothers and fathers and accompanying standard deviation. T-statistic for the difference between the two means and the significance. In this sample,

Two-Way Independent ANOVA - Open University
www.open.ac.ukNow that our variables have been defined, we are almost ready to run the ANOVA. But before we do, we need to ask SPSS to produce some other information for us, to help us understand our data. First, we need to tell SPSS which descriptive and inferential statistics we want it to produce. CLICK on the Options button to do this.

USER’S GUIDE TO - University of California, Irvine
www.socsci.uci.edurepresentations. If you choose SPSS, Stata or Excel for these operations, you need to save the fsQCA file and transfer it to the program of your choice. SPSS In order to open fsQCA data in SPSS, save the fsQCA data spreadsheet in Comma-separated values (*.csv) or comma-delimited file. Make sure that the string variables