Transcription of A Student’s Guide to Interpreting SPSS Output for Basic ...
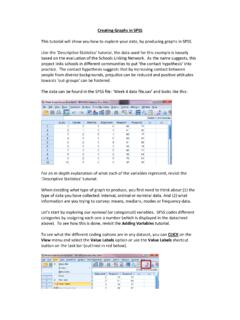
1 A Student s Guide to Interpreting spss Output for Basic AnalysesThese slides give examples of spss Output with notes about interpretation. All analyses were conducted using the Family Exchanges Study, Wave 1 (target dataset)1 from ICPSR. The slides were originally created for Intro to Statistics students (undergrads) and are meant for teaching purposes only2. For more information about the data or variables, please see: Fingerman, Karen. Family Exchanges Study Wave 1. ICPSR36360-v2. Ann Arbor, MI: Inter-university Consortium for Political and Social Research [distributor], 2016-04-14. text used for the course was The Essentials of Statistics: A Tool for Social Research (Healey, 2013). 3 Some variables have been recoded so that higher numbers mean more of what is being measured. In those cases, an r is appended to the original variable DistributionsFrequencies show how many people fall into each answer category on a given question ( variable ) and what percentage of the sample that number of people in the survey sampleNumber of people with valid (non-missing) answers to the questionPercent of the total sample who answered that child1 was marriedNumber of people who responded that child1 was marriedPercent of those with non-missing data on this question who answered that child1 was marriedCumulative percent adds the percent of people answering in one category to the total of those in all categories with lower values.
2 It is only meaningful for variables measured at the ordinal or interval/ratio level. CrosstabulationTables Crosstabs are frequency distributions for two variables together. The counts show how many people in category one of the first variable are also in category one of the second and so on. Number of people who answered that their children are biologically related to them andthat their children need less help than others their age. Marginal: Total number of people who answered that their children need more help than others their age. Marginal: Total number of people who answered that all of their children are biologically related to : Total number of people who had valid data on both D34r and A1A. Crosstabulation Tables (Column %)Crosstabscanbeexamined using either rowor column percentages andtheinterpre tation differs depending on which are of thumb is to percentageon : Percentofsample who feelthat their childrenneedle ss helpthanothers their the sample whose childrenare all biologicall y relatedtothemthatsaidtheir childrenneedle ss helpthanothers their : 100%heretells youthatyou ve percentagedon thisnumber?
3 ( those whose childrenwerenot all biologicall y relatedtothemfelt their childrenneededmorehelpthanothers their age.)Crosstabulation Table (Row%)Percentof those whosaid their childrenneedmorehelp thanotherstheir age whose children are all biologicall y : Percentofthesample whose childrenare biologicall y : 100%hereshows thatyouare interpretthi s number? ( those whosaid their children need about the same amount of help as others their age had children who were not all biologically related to themselves.)Chi Square ( 2)Based on crosstabs, 2is used to test the relationship between two nominal or ordinal variables (or one of each). It compares the actual (observed) numbers in a cell to the number we would expect to see if the variables were unrelated in the population. Actual count (fo).Count expected (fe) if variables were unrelated in pop. fe = 2value (obtained) = 2 This could be compared to a critical value (with the degrees of freedom) but the significance here tells you that there appears to be a relationship between the perceived amount of help needed and whether the children are related to the R.
4 Degrees of freedom = ((# rows 1)(# col 1)) The 2test is sensitive to small expected counts, it is less reliable if feis < 5 for multiple T-testA test to compare the means of two groups on a quantitative (at least ordinal, ideally interval/ratio) dependent variable . Acomputedvariable (dmean_m) exists in this dataset that is the average amount of support R offers mother across all domains (range 1-8); that will be the dependent variable . The actual mean and standard deviation of dmean_mfor each of the number of females and males who have non-missing data for dmean_m. T-value for the difference between and t= 1 2 where = 12 1+ 22 2. (Note, as long as the sig. of F is .05, use the equal variances assumed row, for reasons beyond the scope of these slides).Significance (p) level for t-statistic. If p .05, the two groups have statistically significantly different means. Here, females provide more support to their mothers, on average, than do males.
5 Confidence interval for the difference between the two means. If CI contains 0, the difference will not be statistically significant. Paired-samples T-testLike the independent-samples t-test, this compares two means to see if they are significantly different, but now it is comparing the average of same people s scores on two different variables. Often used to compare pre- and post-test scores, time 1 and time 2 scores, or, as in this case, the differences between the average amount of help Rsgive to their mothers versus to their fathers. Mean amount of support R provided to amount of support R provided to of cases with valid data for both variables. spss also gives the correlation between the two dependent variables, that was left off here for difference between the average amount of support provided to mothers and fathers and accompanying standard for the difference between the two means and the significance. In this sample, respondents provide significantly more support to their mothers than to their fathers.
6 OnewayANOVAA nother test for comparing means, the onewayANOVA is used when the independent variable has three or more categories. You would typically report the F-ratio (and sig.) and use the means to describe the groups. Number of cases in each group of the independent amount of support provided (and standard deviation) by those with incomes < $ Interval: the range within which you can be 95% certain that the group s mean falls for the amount of support provided by all 521 people with valid data on dmean_m. F-statistic (and associated p-value) test the null hypothesis that all groups have the same mean in the population. A significant F means that at least one group is different than the others. Small within groups variance and large between groups produces a higher F value: F= . Here we see that at least one group s mean amount of support is significantly different than the others.
7 Additional (post-hoc) tests can be run to determine which groups are significantly different than each other. Variability of means between the groups: Mean Square Between = where SSB= ( )2and dfb= k-1. (k is number of groups; is # people in a given group; is mean for that group)Variability within each group: Within Groups Mean Square = where SSW = SST-SSB and dfw= Sum of Squares (SST) = SSB + SSWC orrelationPearson s r: measures the strength and direction of association between two quantitative variables. Matrices are symmetric on the coefficient (r) tells how strong the relationship is and in what direction. Range is -1 to 1, with absolute values closer to 1 indicating stronger relationships. Here, the frequency of visits is moderately related to the amount of emotional support given to the mother; more visits correlate with more frequent emotional support. r = ( )( )[ ( )2 ( )2 Significance (p) tells how certain you can be that the relationship displayed is not due to chance.]
8 Typically look for this to be . size: this number may be different in each cell if missing cases are excluded pairwise rather than listwise. Can you interpret this number? (How often mother forgets to ask about R s life is negatively, albeit weakly, related to the amount of emotional support R gives mother If mother forgets to ask a great deal of the time, she gets less emotional support from R.) Bivariate Regression (model statistics)Examines the relationship between a single independent ( cause ) variable and a dependent (outcome) variable . While it s good to look at all numbers, the ones you typically interpret/report are those boxes marked with an * (true for all following slides).Regression line: = + .Coefficient of determination (R2): the amount of variance in satisfaction with help given to mother that is explained by how often the R saw mother. R2 = (TSS SSE)/ TSS. *Multiple correlation (R): in bivariate regression, same as standardized coefficientIndependent (predictor) and Dependent (and associated p-value) tells whether model is statistically significant.
9 Here we can say that the relationship between frequency of visits with ones mother and satisfaction with help given is significant; it is unlikely we would get an F this large by chance. *Residual sum of squared errors (or Sum of Squared Errors, SSE) = ( ) Sum of Squares (TSS) = ( ) Regression (coefficients)Standardized coefficient ( ): influence of x on y in standard units. Confidence Interval the slope +/- (critical t-value * std. error) shows that you can be 95% confident that the slope in the population falls within this range. If range contains 0, variable does not have an effect on error of the estimate: divide the slope by this to get the t-value. *Y-intercept (a): value of y when x is 0. Slope (b): how much y chances for each unit increase in x. Here, for every additional bump up in frequency of visits, satisfaction with the amount of help given to mother increases by .157. *T-statistic (and associated p-value) tells whether the individual variable has a significant effect on dependent variable .
10 *The regression equation (for this model would be = + .157 ( ).Multiple Regression (OLS: model statistics)Used to find effects of multiple independent variables (predictors) on a dependent variable . Provides information about the independent variables as a group as well as individually. Regression line: = a+ 1 1+ 2 2+ 3 multiple correlation. The association between the group of independent variables and the dependent variable . Ranges from 0-1. R2and Adjusted R2 how much of the variance in satisfaction with amount of help R provided mother is explained by the combination of independent variables in the model. Also called coefficient of determination. R2 = (TSS SSE)/ TSS. Adjusted R2compensates for the effect that adding any variable to a model will raise the R2to some degree. About 14% of the variance in satisfaction is accounted for by financial and emotional support, seeing mother in person, and whether mother makes demands on R.)