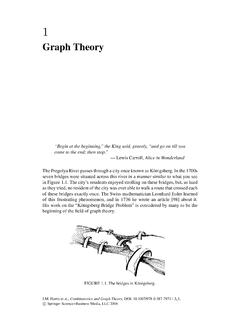
Graph Theory
The vertex set of a graph G is denoted by V(G), and the edge set is denoted by E(G). We may refer to these sets simply as V and E if the context makes the particular graph clear. For notational convenience,instead of representingan edge as {u,v }, we denote this simply by uv . The order of a graph G is the cardinality
Download Graph Theory

Information
Domain:
Source:
Link to this page:
Documents from same domain
WIRELESS COMMUNICATIONS AND NETWORKS
www3.nd.eduWIRELESS COMMUNICATIONS AND NETWORKS WILLIAM STALLINGS The book by William Stallings offers extensive coverage in the area of Wireless Networks. It does not assume any previous knowledge in the fields of Information
CSE 30321 – Computer Architecture I – Fall 2010 …
www3.nd.eduName:_____ CSE 30321 – Computer Architecture I – Fall 2010 Final Exam December 13, 2010 Test Guidelines: 1. Place your name on …
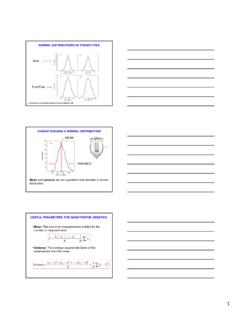
In:Introduction to Quantitative Genetics Falconer …
www3.nd.edu1 NORMAL DISTRIBUTIONS OF PHENOTYPES Mice Fruit Flies In:Introduction to Quantitative Genetics Falconer & Mackay 1996 CHARACTERIZING A NORMAL DISTRIBUTION Meanand variance are two quantities that describe a normal
Angels and Demons - nd.edu
www3.nd.eduIn the First Part of the Summa St. Thomas deals with angels and demons in two separate places: first, ... So the angels are, like God, immaterial substances.
Math 30210 --- Introduction to operations research
www3.nd.eduMath 30210 --- Introduction to operations research University of Notre Dame, Fall 2007 http://www.nd.edu/~dgalvin1/30210/ Course arrangements
Math 30210 — Introduction to Operations Research
www3.nd.eduMath 30210 — Introduction to Operations Research Assignment 1 (50 points total) Due before class, Wednesday September 5, 2007 Instructions: Please present your answers neatly and legibly.
Statistics in Business Course Syllabus
www3.nd.eduStatistics in Business Course Syllabus Information ... widely used business statistics series and is highly regarded in the eld. ... Exam 2 (i.e., the Final Exam) ...
HOW TO WRITE AN EFFECTIVE RESEARCH PAPER
www3.nd.eduHOW TO WRITE AN EFFECTIVE RESEARCH PAPER ... • Add 2-3 paragraphs that discuss previous work. ... good presentation with proper usage of English
LECTURENOTESON GASDYNAMICS - University of …
www3.nd.eduLECTURENOTESON GASDYNAMICS ... These are a set of class notes for a gas dynamics/viscous flow course taught to juniors in ... • solid mechanics
BaseTech 1 Introducing Basic Network Concepts
www3.nd.edu1 Introducing Basic Network Concepts “In the beginning, there were no networks. ... Networking computers first and tracking the connections later can quickly
Related documents

Unit 9 Describing Relationships in Scatter Plots and Line ...
lycofs01.lycoming.eduThe line graph is popular as a visual display to trace how the value of a variable changes through time. Figure 9-3 is a line graph displaying the change over time in the prices of Table 9-1, and Figure 9-4 is a line
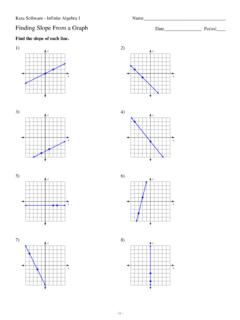
Slope From a Graph.ks-ia1
cdn.kutasoftware.comFind the slope of each line. 1) x y 2) x y 3) x y 4) x y 5) x y 6) x y 7) x y 8) x y-1-©r B2N0w1y2 D nK ru0thay gS SoYf1tPwLasr meq aL4L1Cs. i 2 bA NlblG Trti bgghFtCsd zr vevs se Pr wvreidp. f 9 ZMca sd0e R 2wHist 9hf 8Ian EfDitn 5ibtke c UAvlxg oeUb8r3a W o1 R.q Worksheet by Kuta Software LLC ... Slope From a Graph.ks-ia1
BASIC CALCULUS REFRESHER
pages.stat.wisc.edup = 1, the graph is the straight line y = x. And if 0 < p < 1, then the graph is concave down, such as the parabola y = x1/2 = x.) However, if p < 0, such as y = x 1 = 1 x, or y = x 2 = 1 x2, then the Y-axis acts as a vertical asymptote for the graph, and the X-axis is a horizontal asymptote. Exercise: Why is y = xx not a power function? Sketch ...
LEARNWELL OY
www.ilc.cuhk.edu.hk• Don’t write about everything on the graph. Pick the biggest, the smallest, the main points, the main trends. Group similar things together • Don’t write about the line or the bar: “The line went up,” “The bar went down.” Instead, write about the idea. “The number of people going to …

How to create graphs with a “best fit line” in Excel
www.utsa.eduHow to create graphs with a “best fit line” in Excel . 2In this manual, we will use two examples: y = x, a linear graph; and y = x, a non-linear graph. The y-values were specifically chosen to be inexact to illustrate what you will see when you analyze data from your labs.
RELATIONS & FUNCTIONS Worksheet
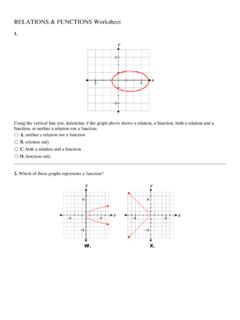
8theastviewmath.weebly.comThe graph does not pass the vertical line test; therefore, the graph is not a function, and it is a relation only. 2. Use the vertical line test to determine if the graphs represent a function. The only graph given that passes the vertical line test is Y. 3. A function maps each domain element to only one range element.
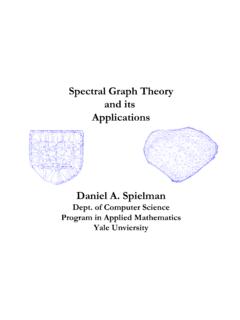
Spectral Graph Theory and its Applications
www.cs.yale.eduSpectral graph drawing: Tutte justification Gives for all i λsmall says x(i) near average of neighbors Tutte ‘63: If fix outside face, and let every other vertex be average of neighbors, get planar embedding of planar graph.

Table of ConTenTs
nces.ed.govLine graphs can be used to show how something changes over time. Line graphs are good for plotting data that has peaks (ups) and valleys (downs), or that was collected in a short time pe-riod. The following pages describe the different parts of a line graph. the titLe The title offers a short explanation of what is in your graph.

Distance vs. Time Graph Worksheet
www.sfponline.org2) Draw a distance vs time graph of a dog that is tied to a 4 foot rope and travels in 1 complete circle 3) You leave Math class to walk to the nearest bathroom.