Example: bankruptcy
Table of ConTenTs
Line graphs can be used to show how something changes over time. Line graphs are good for plotting data that has peaks (ups) and valleys (downs), or that was collected in a short time pe-riod. The following pages describe the different parts of a line graph. the titLe The title offers a short explanation of what is in your graph.
Tags:
Information
Domain:
Source:
Link to this page:
Documents from same domain
U.S. Department of Education Office of Educational ...
nces.ed.govOffice of Educational Research and Improvement U.S. Department of Education Richard W. Riley ... local school system administrators realize the value of having well- ... accounting principles (GAAP), 1 a uniform minimum standard of. and guidelines for financial accounting and reporting. For LEA's,
Financial Accounting for Local and State School …
nces.ed.govFinancial Accounting for . Local and State School Systems: 2014 Edition. NCES 2015-347. U.S. DEPARTMENT OF EDUCATION
National Assessment of Educational Progress: 2017 …
nces.ed.govNational Assessment of Educational Progress 2017 Grade 4 Sample Questions Booklet I. About This Sample Questions Booklet ..... 3
Data Analysis, Statistics, and Probability
nces.ed.gov(The probability was 74 percent for a 4-option multiple-choice question and 72 percent for a 5-option multiple-choice question.) Only selected questions are presented. The number 4, 8, or 12 in parentheses is the grade level at which the question was asked.
Restricted-Use Data Procedures Manual
nces.ed.govRestricted-Use Data Procedures Manual U.S. Department of Education Institute of Education Sciences National Center for Education Statistics IES Data Security Office
2018 NCES STATS-DC Data Conference
nces.ed.gov2018 NCES STATS-DC Data Conference July 25–27, 2018 Session I Session II // AGENDA AT-A-GLANCE Room Palm Court Ballroom (Lobby)

STATS IN BRIEF Public 2-year educational
nces.ed.govemployment before, during, and after their postsecondary enrollment. 4. 4 Although students may eventually earn a certificate or degree more than 3 years after first beginning postsecondary education, 3-year degree attainment is the only outcome measure available in the BPS:12/14 data.

Architectural Design and Best Practices Project Final ...
nces.ed.govinterviews and best practices case studies that were presented to the Virginia Department of Education between October 2010 and Decem The Architectural Best Practices Report (A0 a list of candidate SLDS and large data integr published analyses, reports, and case studies ber 2010. 004) focused on initial data sourcing, both to develop
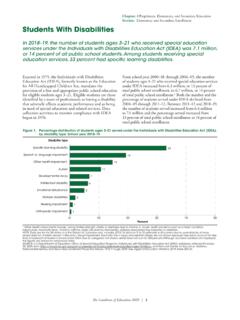
Children and Youth With Disabilities
nces.ed.govEnacted in 1975, the Individuals with Disabilities Education Act (IDEA), formerly known as the Education for All Handicapped Children Act, mandates the provision of a free and appropriate public school education for eligible students ages 3–21. Eligible students are those ... Children and Youth With Disabilities
National Assessment of Educational Progress: 2017 Grade 8 ...
nces.ed.govThis booklet includes the NAEP 2017 survey questionnaires for grade 8 for mathematics, reading, and writing, as well as sample questions for these three subjects in …
Related documents

Unit 9 Describing Relationships in Scatter Plots and Line ...
lycofs01.lycoming.eduThe line graph is popular as a visual display to trace how the value of a variable changes through time. Figure 9-3 is a line graph displaying the change over time in the prices of Table 9-1, and Figure 9-4 is a line

How to create graphs with a “best fit line” in Excel
www.utsa.eduHow to create graphs with a “best fit line” in Excel . 2In this manual, we will use two examples: y = x, a linear graph; and y = x, a non-linear graph. The y-values were specifically chosen to be inexact to illustrate what you will see when you analyze data from your labs.
RELATIONS & FUNCTIONS Worksheet
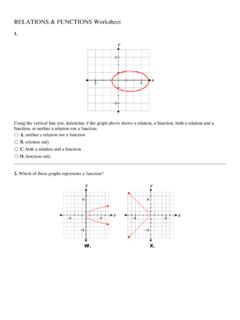
8theastviewmath.weebly.comThe graph does not pass the vertical line test; therefore, the graph is not a function, and it is a relation only. 2. Use the vertical line test to determine if the graphs represent a function. The only graph given that passes the vertical line test is Y. 3. A function maps each domain element to only one range element.
BASIC CALCULUS REFRESHER
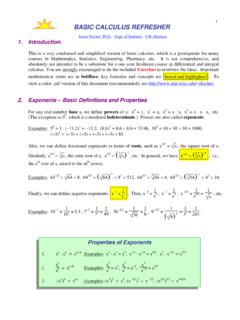
pages.stat.wisc.edup = 1, the graph is the straight line y = x. And if 0 < p < 1, then the graph is concave down, such as the parabola y = x1/2 = x.) However, if p < 0, such as y = x 1 = 1 x, or y = x 2 = 1 x2, then the Y-axis acts as a vertical asymptote for the graph, and the X-axis is a horizontal asymptote. Exercise: Why is y = xx not a power function? Sketch ...
Slope From a Graph.ks-ia1
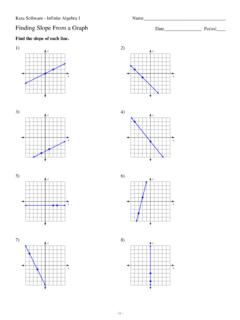
cdn.kutasoftware.comFind the slope of each line. 1) x y 2) x y 3) x y 4) x y 5) x y 6) x y 7) x y 8) x y-1-©r B2N0w1y2 D nK ru0thay gS SoYf1tPwLasr meq aL4L1Cs. i 2 bA NlblG Trti bgghFtCsd zr vevs se Pr wvreidp. f 9 ZMca sd0e R 2wHist 9hf 8Ian EfDitn 5ibtke c UAvlxg oeUb8r3a W o1 R.q Worksheet by Kuta Software LLC ... Slope From a Graph.ks-ia1
LEARNWELL OY
www.ilc.cuhk.edu.hk• Don’t write about everything on the graph. Pick the biggest, the smallest, the main points, the main trends. Group similar things together • Don’t write about the line or the bar: “The line went up,” “The bar went down.” Instead, write about the idea. “The number of people going to …
Spectral Graph Theory and its Applications
www.cs.yale.eduSpectral graph drawing: Tutte justification Gives for all i λsmall says x(i) near average of neighbors Tutte ‘63: If fix outside face, and let every other vertex be average of neighbors, get planar embedding of planar graph.

Distance vs. Time Graph Worksheet
www.sfponline.org2) Draw a distance vs time graph of a dog that is tied to a 4 foot rope and travels in 1 complete circle 3) You leave Math class to walk to the nearest bathroom.
Graph Theory
www3.nd.eduThe vertex set of a graph G is denoted by V(G), and the edge set is denoted by E(G). We may refer to these sets simply as V and E if the context makes the particular graph clear. For notational convenience,instead of representingan edge as {u,v }, we denote this simply by uv . The order of a graph G is the cardinality