Transcription of Data Analysis, Statistics, and Probability
1 Chapter 6 Student Work and Teacher Practices in Mathematics145 data analysis , Statistics, and ProbabilityContent Strand DescriptionQuestions in this content strand assessed students skills in collecting, organizing, reading,representing, and interpreting data . Also assessed were students understanding of the basicelements of sampling, data analysis , and Probability as well as their competence in calculatingsimple statistics and probabilities. Many questions required a constructed response and askedstudents to do a variety of tasks, such as completing or discussing charts and graphs ordescribing the best ways to collect or display at grade 4 were expected to be familiar with a variety of types of graphs(typically pictorial), make predictions from data and explain their reasoning, and use the basicconcept of chance.
2 At grade 8, students were expected to analyze statistical claims and designexperiments, demonstrate some understanding of sampling, and be able to make predictionsbased on complex data . Students at grade 12 were expected to use a wide variety of statisticaltechniques to model situations and solve problems. They also were expected to understand andapply concepts of Probability to dependent and independent events and to have someknowledge of conditional of Individual Questions andStudent PerformanceA number of the data analysis , statistics , and Probability questions from the NAEP 1996mathematics assessment are shown in this chapter. Presentation of the questions is organizedaround three areas of emphasis.
3 Tables, graphs, and charts includes questions that assessedstudents abilities to interpret and display data ; sampling and statistics includes questions thatassessed students knowledge and skills in these areas; and Probability includes questions thatassessed students understanding of and ability to calculate the Probability of simple andrelated Work and Teacher Practices in MathematicsAll sample questions from this content strand are mapped onto the NAEP mathematicsscale as shown in Figure Specific instructions on how to interpret this map are given at theend of Chapter 2. The map is included to provide an indication of the relative difficulty of eachexample question and, thus, to indicate the type of material mastered within this content strandby students with varying degrees of mathematics proficiency.
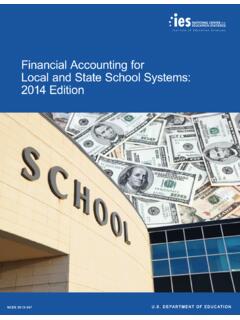
4 As noted in previous chapters,however, the difficulty of any question is a function of the relationship between characteristicsspecific to the question ( , format, absence or presence of graphics, real-world application),the specific mathematics content associated with the question, and students opportunities tolearn this content. It should be remembered also that overall performance on the data Analysis, statistics , and Probability content strand is not determined solely by performance on theexamples presented here. These examples illustrate only some of what students know andcan Work and Teacher Practices in Mathematics147 Map of Selected data analysis , statistics , andProbability Questions on the NAEP CompositeMathematics Scale (Item Map)Grade 12 Average:Grade 8 Average:Grade 4 Average:NOTE: Each mathematics question was mapped onto the NAEP 0 to 500 mathematics scale.
5 The position of the question on thescale represents the scale score obtained by students who had a 65 percent Probability of successfully answering the question.(The Probability was 74 percent for a 4-option multiple-choice question and 72 percent for a 5-option multiple-choice question.)Only selected questions are presented. The number 4, 8, or 12 in parentheses is the grade level at which the question was : National Center for Education statistics , National Assessment of Educational Progress (NAEP) 1996 Mathematics : Position of questions is ScaleFigure (12) Use data in Table to Compute Average Hourly Wageand Determine When Wage Rate Changes (420)(8) Recognize Misleading Graph (475)(8) Reason About Sample Space (235)(8) Use data from a Chart (286)(12) Use data from a Chart (295)(246) Read a Bar Graph (4)(463) Compare Mean and Median (12)(411) Compare Probabilities (12)(289) Identify Representative Sample (8)(278) Determine a Probability (4)(265) Use data from a Chart (4)
6 148 Student Work and Teacher Practices in MathematicsTables, graphs, and chartsThese questions assessed students abilities to interpret and display data in tables, graphs, andcharts. At all grade levels, students had to read and interpret data , make predictions, computewith data , and interpolate and extrapolate. They also had to translate data into tables andgraphs. Questions for fourth-grade students often used pictographs, with symbols representingsingle or multiple units. Fourth-grade students also were evaluated on their ability to interpretsimple pie charts. Questions for older students included stem-and-leaf and box-and-whiskerplots. Graphs and charts often involved percents, and graphs often compared units on twodimensions.
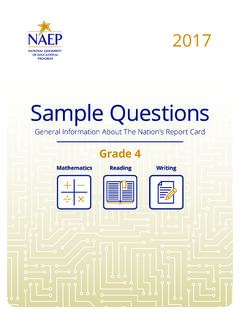
7 Students in eighth and twelfth grade were asked to make decisions about the bestrepresentation of data for certain situations or to compare data in two different tables, graphs,or examples of questions are presented here one at each grade level and one thatappeared at all three grade levels. The first example is a multiple-choice question thatappeared on the assessment for fourth-grade students. The question presented students with abar graph representing class votes on favorite types of music. Results for three types of musicand a residual other category were displayed separately for boys and girls. A legend indicatedthat the square symbol used in the graph represented one student.
8 Students were to determinethe type of music preferred by most of the students in the class. In order to respond correctly,students had to add the number of votes for boys and girls together within categories andcompare the correct option is Work and Teacher Practices in Mathematics149 This question was not very difficult for fourth-grade students. It mapped at a score of246 on the NAEP composite mathematics scale. Student performance data are presented inTables and Nearly 60 percent of the students responded correctly to the 36 percent of the students chose Option C (country music) as the appropriate students may not have understood that they had to sum the data for girls and boys andmay have simply chosen the category with the longest bar.
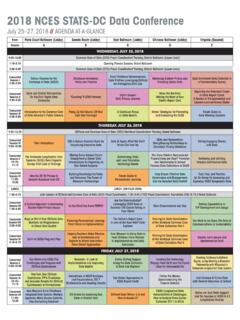
9 Table shows that approximatelytwo-thirds of the students at the Basic achievement level and more than 80 percent of those atthe Proficient level responded correctly to the Correct for Read a Bar Graph Percentage Correct** Sample size is insufficient to permit a reliable : National Center for Education statistics , National Assessment of Educational Progress (NAEP) 1996 Mathematics Islander**American Indian**Table 4 OverallBelow BasicBasicProficientAdvanced59386682**Pe rcentage Correct Within Achievement-LevelIntervals for Read a Bar Graph NAEP Grade 4 Composite Scale Range** Sample size is insufficient to permit a reliable : National Center for Education statistics , National Assessment of Educational Progress (NAEP) 1996 Mathematics Work and Teacher Practices in MathematicsThe second example for this area was a question that appeared on the assessment for allthree grade levels.
10 It is a short constructed-response question for which students had tointerpret data from a table and then explain their interpretation. The data in this question againrepresented votes, this time regarding shapes that were being considered for a class symbol.(The question fell within a block for which students were supplied with cardboard shapes ormanipulatives. The designations N, P, and Q that are used in the question refer to theseshapes.) Based on the preference data from three classes, students were to determine whichshape should be selected for the symbol and tell why. The correct response was shape Nbecause it received more total votes than the other two shapes; students also could have statedthat it was the first choice in one class and the second choice in the Work and Teacher Practices in Mathematics151A sample correct response follows.