Transcription of STATS IN BRIEF Public 2-year educational
1 STATS IN BRIEF DEPARTMENT OF EDUCATION JULY 2018 NCES 2018-428 Working before , during , and after Beginning at a Public 2-year Institution: Labor Market Experiences of Community College Students AUTHORS Erin Dunlop Velez Alexander Bentz Caren A. Arbeit RTI International PROJECT OFFICER Sean A. Simone National Center for Education Statistics Statistics in BRIEF publications present descriptive data in tabular formats to provide useful information to a broad audience, including members of the general Public . They address simple and topical issues and questions.
2 They do not investigate more complex hypotheses, account for inter-relationships among variables, or support causal inferences. We encourage readers who are interested in more complex questions and in-depth analysis to explore other NCES resources, including publications, online data tools, and Public - and restricted-use datasets. See and references noted in the body of this document for more information. This Statistics in BRIEF was prepared for the National Center for Education Statistics under Contract No. ED-IES-12-C-0095 with RTI International. Mention of trade names, commercial products, or organizations does not imply endorsement by the Government.
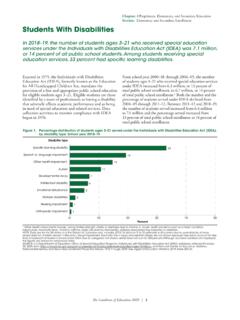
3 Public 2-year educational institutions serve various purposes for a large and diverse population of students (Cohen, Brawer, and Kisker 2014). In 2011 12, about 40 percent of all postsecondary students were enrolled in a Public 2-year institution (Skomsvold 2014), and about one-third of all students at 4-year institutions had attended a Public 2-year institution at some time (Radford, Cominole, and Skomsvold 2015). Furthermore, compared with students in 4-year institutions, proportionally more Public 2-year students are Nontraditional students are defined by Radford, Cominole, and Skomsvold (2015) as having any of the following characteristics: being independent for financial aid purposes, having one or more dependents, being a single caregiver, not having a traditional high school diploma, delaying postsecondary enrollment, attending school part time, and being employed full time.
4 In 2011 12, for example, 60 percent of Public 2-year students were independent, 32 percent had dependents, and 34 percent first enrolled more than 12 months after graduating from high school. Among students in Public 4-year colleges, the corresponding percentages were 36 percent, 15 percent, and 17 percent, respectively (Radford, Cominole, and Skomsvold 2015). 2 Many students with prior labor market experience enroll in Public 2-year institutions to acquire new skills or certifications in order to advance in their careers or transition to new careers (Jacobson, Lalonde, and Sullivan 2005; Jenkins et al.)
5 2010; Leigh and Gill 1997). These students often continue to work, in many cases full time, while enrolled. In 2011 12, about one-third (32 percent) of Public 2-year students worked full time while enrolled, compared with 18 percent of Public 4-year students (Radford, Cominole, and Skomsvold 2015). Additionally, when given the opportunity to identify themselves as an employee enrolled in school or a student working to meet expenses, 28 percent of Public 2-year students in 2011 12 considered themselves an employee enrolled in school, compared with 12 percent of students at Public 4-year institutions (Skomsvold 2014).
6 22 The analyses in both Skomsvold (2014) and Radford, Cominole, and Skomsvold (2015) use data from the 2011 12 National Postsecondary Student Aid Study (NPSAS:12), which surveyed a nationally representative sample of postsecondary students in 2011 12. In addition to differences in their employment experiences, Public 2-year students academic lives also differ from those of their peers in Public 4-year institutions. In particular, proportionally fewer Public 2-year students than Public 4-year students enroll full time.
7 In 2011 12, some 20 percent of all undergraduates at Public 2-year institutions were enrolled full time, compared with 53 percent of all undergraduates at Public 4-year institutions (Skomsvold 2014). More students enrolled at Public 2- year institutions work full time and more are enrolled part time. As this report focuses on the experiences of beginning Public 2-year students, it is worth noting that both working full time while enrolled and not enrolling full time are negatively associated with postsecondary completion rates, although there is less evidence that working part time has negative effects on postsecondary completion (Darolia 2014; Skomsvold, Radford, and Berkner 2011).
8 33 Some of these findings describe all postsecondary students, not beginning Public 2-year students specifically. For example, about one-half (49 percent) of 2003 04 beginning postsecondary students who worked full time during their first year in college had not earned a credential and were not enrolled in 2009. In contrast, among their peers who did not work during their first year in college, 29 percent had not earned a credential and were not enrolled 6 years later (Skomsvold, Radford, and Berkner 2011). To examine the relationships between beginning Public 2-year students academic progress and labor market participation, this report uses data from the 2012/14 Beginning Postsecondary Students Longitudinal Study (BPS:12/14).
9 The report explores the demographics, enrollment intensity, and 3-year attainment and persistence of students who started in Public 2-year institutions in 2011 12 in relation to their employment before , during , and after their postsecondary 4 Although students may eventually earn a certificate or degree more than 3 years after first beginning postsecondary education, 3-year degree attainment is the only outcome measure available in the BPS:12/14 data. For ease of presentation, throughout the remaining sections of this report, the term beginning Public 2-year students refers to first-time students enrolled in certificate or associate s degree programs at Public , primarily associate s degree-granting institutions categorized as Public associate s degree institutions per the 2010 basic Carnegie Classification in 2011 Throughout the report, all statistics are representative of the experiences of first-time Public 2-year students, not all Public 2-year students.
10 For example, although many Public 2-year students may have attended another institution previously, the nationally representative sample of students examined in this analysis includes only beginning postsecondary students whose first postsecondary enrollment was in 2011 12. This definition includes some students enrolled in 4-year institutions that primarily granted certificates and associate s degrees. All comparisons of estimates were tested for statistical significance using the Student s t statistic, and all differences cited are statistically significant at the p < .05 6 All estimates in this publication are weighted using the balanced repeated replication and jackknife II methods to adjust variance estimation for the complex sample design (Wolter 2007).