Hypothesis Testing
Example 2: Weight Loss for Diet vs Exercise Step 3. Determine the p-value. Recall the alternative hypothesis was two-sided. p-value = 2 × [proportion of bell-shaped curve above 2.17] Table 8.1 => proportion is about 2 × 0.015 = 0.03. Step 4. Make a decision. The p-value of 0.03 is less than or equal to 0.05, so …
Download Hypothesis Testing

Information
Domain:
Source:
Link to this page:
Documents from same domain

TIME SERIES MODELLING, INFERENCE AND …
www2.stat.duke.eduTIME SERIES MODELLING, INFERENCE AND FORECASTING ... A time series process is a stochastic process or a collection of random variables yt indexed in time. Note that yt will be used throughoutthe book to denote a random variable or an actual realisation of the time series process at time t. We use the

www2.stat.duke.edu
www2.stat.duke.eduRyan Tibshirani Data Mining: 36-462/36-662 January 22 2013 Optional reading: ESL 1410 . Information retrieval with the web information retrieval learned how to compute similarity Last time: scores (distances) of documents to a given query string But what if documents are webpages,

Chapter 3 - continued Chapter 3 sections
www2.stat.duke.eduChapter 3 - continued Chapter 3 sections ... We have the law of total probability for random variables (Theorem 3.6.3 in the book) We also have Bayes’ theorem for random variables (Theorem ... Chapter 3 - continued 3.7 Multivariate Distributions Multivariate Distributions - extension of bivariate ...

General Bivariate Normal - Duke University
www2.stat.duke.edu6.5 Conditional Distributions Multivariate Normal Distribution Matrix notation allows us to easily express the density of the multivariate normal distribution for an arbitrary number of dimensions. We express the k-dimensional multivariate normal distribution as follows, X ˘N k( ; There is a similar method for the multivariate normal ...
Multivariable Calculus - Duke University
www2.stat.duke.eduplanes and trajectories. Chapter 5 uses the results of the three chapters preceding it to prove the Inverse Function Theorem, then the Implicit Function Theorem as a corollary, and finally the Lagrange Multiplier Criterion as a consequence of the Implicit Function Theorem. Lagrange multipliers help with a type of multivariable
Convergence in Distribution Central Limit Theorem
www2.stat.duke.eduCentral Limit Theorem Theorem. [Central Limit Theorem (CLT)] Let X1;X2;X3;::: be a sequence of independent RVs having mean „ and variance ¾2 and a common distribution function F(x) and moment generating function M(t) deflned in a neighbourhood of zero. Let Sn = Xn i=1 Xn Then lim n!1 P • Sn ¡n„ ¾ p n • x ‚ = '(x) That is Sn ¡n ...
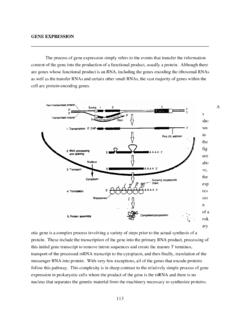
GENE EXPRESSION - Duke University
www2.stat.duke.educlasses of genes most clearly is the complexity of regulatory elements and factors necessary for the transcription of the mRNA genes. As stated before, transcription factors possess two essential properties - the ability to ... functional domains of a yeast transcription factor have been separated in two vectors. Sequences

Tree Based Methods: Regression Trees
www2.stat.duke.eduBasicsofDecision(Predictions)Trees I Thegeneralideaisthatwewillsegmentthepredictorspace intoanumberofsimpleregions. I Inordertomakeapredictionforagivenobservation,we ...
Lecture 20 - Logistic Regression - Duke University
www2.stat.duke.eduIt seems clear that both age and gender have an e ect on someone’s survival, how do we come up with a model that will let us explore this relationship? Even if we set Died to 0 and Survived to 1, this isn’t something we can transform our way out of - we need something more. One way to think about the problem - we can treat Survived and Died as

Lecture 16 - Correlation and Regression - Duke University
www2.stat.duke.eduCorrelation Covariance and Correlation Guessing the correlation Which of the following is the best guess for the correlation between % in poverty and % HS grad? l l l l l l l l l l l l l l l l l l l l l l l l l l l l l l l l l l l l l l l l l l l 80 85 90 6 8 10 12 14 16 18 % HS grad % in poverty (a)0.6 (b)-0.75 (c)-0.1 (d)0.02 (e)-1.5 ...
Related documents

Birth to 24 months: Girls Head circumference-for-age and ...
www.cdc.govNov 01, 2009 · Head circumference-for-age and Weight-for-length percentiles NAME RECORD # 42 44 46 52 50 48 W E I G H T W E I G H T kg lb 14 20 18 14 16 12 10 8 6 4 2 9 8 7 2 in cm lb kg 1 3 22 24 10 11 12 6 5 E 66 68 70 72 74 76 7880 82 84 86 88 90 92 94 9698100102104106108 cm in Published by the Centers for Disease Control and Prevention, November 1, 2009
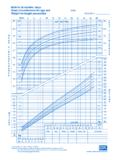
Birth to 36 months: Boys, Head circumberence-for-age and ...
www.cdc.govHead circumference-for-age and Weight-for-length percentiles NAME RECORD # 12 Birth 3 6 9 12 15 18 21 24 27 30 33 36 52 50 48 46 44 42 40 38 36 32 cm 52 50 48 46 44 cm 20 19 18 17 16 15 14 13 in 20 19 18 in H E A D C I R C U M F E R E N C E 34 17 H E A D C I R C U M F E R E N C E AGE (MONTHS) 95 90 50 25 10 5 75 30 42 Published May 30, 2000 ...
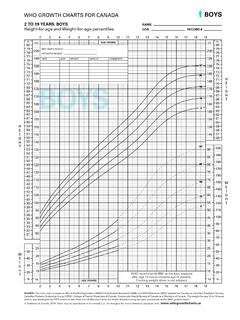
2 TO 19 YEARS: BOYS NAME: Height-for-age and Weight-for ...
www.dietitians.caHeight-for-age and Weight-for-age percentiles WHO GROWTH CHARTS FOR CANADA NAME: DOB: RECORD # 10 15 20 25 10 15 20 25 30 40 45 50 55 60 65 70 75 80 85 90 ... DATE AGE HEIGHT WEIGHT COMMENTS 3 15 50 85 97 3 15 50 85 97. Title: HFA-WFA_2-19_BOYS_EN_Extended Created Date: 3/14/2014 3:46:19 PM ...