Transcription of Tree Based Methods: Regression Trees
1 tree Based Methods: Regression TreesRebecca C. Steorts, Duke UniversitySTA 325, Chapter 8 ISL1 / 49 AgendaIWhat are tree Based methods?IRegression treesIMotivation using Hitter s data setIHow to interpret a Regression treeIHow to build a Regression treeIApplication2 / 49 Basics of Decision (Predictions) TreesIThe general idea is that we will segment the predictor spaceinto a number of simple order to make a prediction for a given observation, wetypically use the mean of the training data in the region towhich it the set of splitting rules used to segment the predictorspace can be summarized by a tree such approaches are calleddecision tree methods are simple and useful for / 49 Basics of Decision TreesIWe want to predict a response or classYfrom inputsX1,X2.
2 Xp. We do this by growing a binary each internal node in the tree , we apply a test to one of theinputs, on the outcome of the test, we go to either the leftor the right sub-branch of the we come to a leaf node, where we make a prediction aggregates or averages all the training datapoints which reach that / 49 Basics of Decision TreesIDecision Trees can be applied to both Regression andclassification will first consider Regression Trees and then move ontoclassification / 49 Regression TreesIn order to motivate Regression Trees , we begin with a / 49 Prediction of baseball player s salaryIOur motivation is to to predict a baseball player s Salary basedon Years (the number of years that he has played in the majorleagues) and Hits (the number of hits that he made in theprevious year).
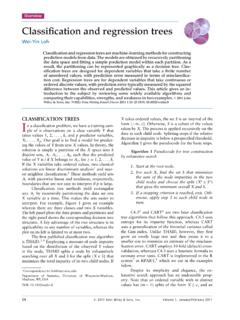
3 IWe first remove observations that are missing Salary values,and log-transform Salary so that its distribution has more of atypical that Salary is measured in thousands of / 49 Prediction of baseball player s salaryFigure 1: A Regression tree for predicting the log salary of a baseball player, Based on the number of years that he has played in the major leagues andthe number of hits that he made in the previous year. At a given internalnode, the label (of the formXj<tk) indicates the left-hand branchresulting from that split, and the right-hand branch corresponds toXj / 49 What does the tree mean?
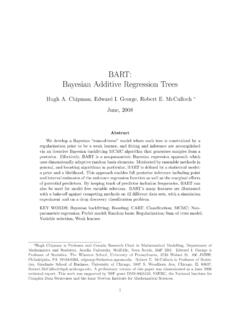
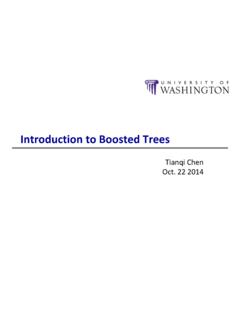
4 IThe tree represents a series of splits starting at the top of top split assigns observations havingYears< to theleft predicted salary for these players is given by the meanresponse value for the players in the data set withYears< such players, the mean log salary is , and so we makea prediction of dollars, 165,1749 / 49 What does the tree mean?IHow would you interpret the rest (right branch) of the tree ?10 / 49 Prediction of baseball player s salaryFigure 2: The three-region partition for the Hitters data set from theregression tree illustrated in Figure / 49 What do the regions mean?
5 Figure 3: The three-region partition for the Hitters data set from theregression tree illustrated in Figure can write these regions as the |Years< |Years ,Hits< |Years ,Hits / 49 TerminologyIIn keeping with the tree analogy, the regionsR1,R2,andR3are known asterminal nodesorleavesof the is the case for Figure 2, decision Trees are typically drawnupside down, in the sense that theleaves are at the bottomof the points along the tree where the predictor space is split arereferred to asinternal Figure 2, the two internal nodes are indicated by the textYears< andHits< refer to the segments of the Trees that connect the / 49 Interpretation of Figure 2 IYears is the most important factor in determining Salary, andplayers with less experience earn lower salaries than moreexperienced that a player is less experienced, the number of hits thathe made in the previous year seems to play little role in among players who have been in the major leagues for fiveor more years, the number of hits made in the previous yeardoes affect salary.
6 And players who made more hits last yeartend to have higher Regression tree shown in Figure 2 is likely anover-simplification of the true relationship between Hits, Years,and Salary, but it s a very nice easy interpretation over morecomplicated / 49 How do we build the Regression tree ?1. We divide the predictor space that is, the set of possiblevalues forX1,..,Xp intoJdistinct and non-overlappingregions,R1,.., every observation that falls into the regionRj, we make thesame prediction, which is simply the mean of the responsevalues for the training observations that in Step 1, we obtain two regions and that theresponse mean of the training observations in the first region is 10,while the response mean in the second region is 20.
7 Then for agiven observationX=x,ifx R1, we will predict a value of 10,and ifx R2, we will predict a value of how do we actually construct the regions?15 / 49 Constructing the regionsIThe regions in theory could have any , we choose to divide the predictor space intohigh-dimensional rectangles or boxes (for simplicity and ease ofinterpretation of the resulting predictive model).Our goal is to find boxesR1,..,RJthat minimize the RSS given byRSS=J j=1 i Rj(yi yRj)2,(1)where yRjis the mean response for the training observations withinthejth / 49 Issue with this constructionIComputationally infeasible to consider every possible partitionof the feature space into J , we take a top-down, greedy approach calledrecursivebinary top-down since it begins at the top of the tree (allobservations below to a single region)
8 And then successivelysplits the predictor split is indicated via two new branches further down onthe is greedy since at each step of the tree building process, thebest split is made at that particular split (rather than lookingahead and picking a split that will lead to a better tree in afuture split).17 / 49 How to build Regression Trees ?IOne alternative is to the build the tree so long as the decreasein RSS due to each split exceeds a threshold (high).IThis results in smaller Trees , however, this is problematic sincea worthless split early on in the three might be followed by avery good split later on that is, a split that leads to a largereduction in RSS later / 49 How to build Regression Trees PruningIA better strategy is to grow a very large treeToand thenpruneit back to obtain a to we find the best subtree?
9 IWe want to select a subtree that leads to the lowest test a subtree, we can estimate the test error rate usingcross-validation (CV).INote that estimate the CV for every possible subtree wouldtake a long time since there are many , we need a way to select a small set of subtrees / 49 PruningCost complexity pruningor weakest link pruning gives us a way todo just this!Rather than looking at all possible subtrees, we consider a sequenceof Trees indexed by a nonnegative tuning parameter .20 / 49 Algorithm for Building a Regression Tree1. Use recursive binary splitting to grow a large tree on thetraining data, stopping only when each terminal node has fewerthan some minimum number of Apply cost complexity pruning to the large tree in order toobtain a sequence of best subtrees, as a function of.
10 3. UseK-fold cross-validation to choose .That is, divide thetraining observations intoKfolds. For eachk=1,.., Repeat Steps 1 and 2 on all but the kth fold of the Evaluate the mean squared prediction error on the data in theleft-out kth fold, as a function of .Average the results for each value of , and pick to minimizethe average the subtree from Step 2 that corresponds to the chosenvalue of .21 / 49 Algorithm for Building a Regression tree (continued)I|T|indicates the number of terminal nodes of the tree TIRmis the rectangle or box corresponding to themth terminalnodeI yRmis the predicted response associated withRmI controls a trade-off between the subtree s complexity and itsfit to the training dataFor each value of , there is a corresponding subtreeT Tosuchthat|T| m=1 xi Rm(yi yRm)2+ |T|(2)is as small as / 49 Algorithm for Building a Regression tree (continued)