
Tree Based Methods: Regression Trees
BasicsofDecision(Predictions)Trees I Thegeneralideaisthatwewillsegmentthepredictorspace intoanumberofsimpleregions. I Inordertomakeapredictionforagivenobservation,we ...
Download Tree Based Methods: Regression Trees

Information
Domain:
Source:
Link to this page:
Documents from same domain

TIME SERIES MODELLING, INFERENCE AND …
www2.stat.duke.eduTIME SERIES MODELLING, INFERENCE AND FORECASTING ... A time series process is a stochastic process or a collection of random variables yt indexed in time. Note that yt will be used throughoutthe book to denote a random variable or an actual realisation of the time series process at time t. We use the

www2.stat.duke.edu
www2.stat.duke.eduRyan Tibshirani Data Mining: 36-462/36-662 January 22 2013 Optional reading: ESL 1410 . Information retrieval with the web information retrieval learned how to compute similarity Last time: scores (distances) of documents to a given query string But what if documents are webpages,

Chapter 3 - continued Chapter 3 sections
www2.stat.duke.eduChapter 3 - continued Chapter 3 sections ... We have the law of total probability for random variables (Theorem 3.6.3 in the book) We also have Bayes’ theorem for random variables (Theorem ... Chapter 3 - continued 3.7 Multivariate Distributions Multivariate Distributions - extension of bivariate ...
Hypothesis Testing - Duke University
www2.stat.duke.eduNull hypothesis: No difference in average fat lost in population for two methods. Population mean difference is zero. Alternative hypothesis: There is a difference in average fat lost in population for two methods. Population mean difference is not …

General Bivariate Normal - Duke University
www2.stat.duke.edu6.5 Conditional Distributions Multivariate Normal Distribution Matrix notation allows us to easily express the density of the multivariate normal distribution for an arbitrary number of dimensions. We express the k-dimensional multivariate normal distribution as follows, X ˘N k( ; There is a similar method for the multivariate normal ...

Multivariable Calculus - Duke University
www2.stat.duke.eduplanes and trajectories. Chapter 5 uses the results of the three chapters preceding it to prove the Inverse Function Theorem, then the Implicit Function Theorem as a corollary, and finally the Lagrange Multiplier Criterion as a consequence of the Implicit Function Theorem. Lagrange multipliers help with a type of multivariable
Convergence in Distribution Central Limit Theorem
www2.stat.duke.eduCentral Limit Theorem Theorem. [Central Limit Theorem (CLT)] Let X1;X2;X3;::: be a sequence of independent RVs having mean „ and variance ¾2 and a common distribution function F(x) and moment generating function M(t) deflned in a neighbourhood of zero. Let Sn = Xn i=1 Xn Then lim n!1 P • Sn ¡n„ ¾ p n • x ‚ = '(x) That is Sn ¡n ...
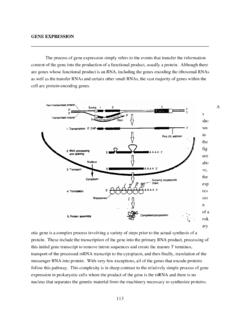
GENE EXPRESSION - Duke University
www2.stat.duke.educlasses of genes most clearly is the complexity of regulatory elements and factors necessary for the transcription of the mRNA genes. As stated before, transcription factors possess two essential properties - the ability to ... functional domains of a yeast transcription factor have been separated in two vectors. Sequences
Lecture 20 - Logistic Regression - Duke University
www2.stat.duke.eduIt seems clear that both age and gender have an e ect on someone’s survival, how do we come up with a model that will let us explore this relationship? Even if we set Died to 0 and Survived to 1, this isn’t something we can transform our way out of - we need something more. One way to think about the problem - we can treat Survived and Died as

Lecture 16 - Correlation and Regression - Duke University
www2.stat.duke.eduCorrelation Covariance and Correlation Guessing the correlation Which of the following is the best guess for the correlation between % in poverty and % HS grad? l l l l l l l l l l l l l l l l l l l l l l l l l l l l l l l l l l l l l l l l l l l 80 85 90 6 8 10 12 14 16 18 % HS grad % in poverty (a)0.6 (b)-0.75 (c)-0.1 (d)0.02 (e)-1.5 ...
Related documents

Machine Learning: Decision Trees
pages.cs.wisc.edux •The input •These names are the same: example, point, instance, item, input •Usually represented by a feature vector –These names are the same: attribute, feature
Classification and regression trees
pages.stat.wisc.eduWIREs Data Mining and Knowledge Discovery Classification and regression trees X1 X 2 1 1 1 1 1 1 1 1 1 1 1 1 1 1 1 1 1 2 1 2 2 2 2 2 2 2 2 2 2 2 2 2 2 2 2 2 2 3 3 3 ...
BART: Bayesian Additive Regression Trees
www-stat.wharton.upenn.eduditive Regression Trees) which uses a sum of trees to model or approximate f(x) = E(Y j x). The essential idea is to elaborate the sum-of-trees model (2) by imposing a prior that regularizes the flt by keeping the individual tree efiects small. In efiect, the gj’s become a dimensionally adaptive random basis of \weak

Classification and Regression by randomForest
cogns.northwestern.eduType of random forest: regression Number of trees: 500 No. of variables tried at each split: 4 Mean of squared residuals: 10.64615 %Varexplained:87.39 The “mean of squared residuals” is computed as MSE OOB = n−1 n ∑ 1 {y i − yˆOOB i} 2, where yˆOOB i is the average of the OOB predictions for the ith observation. The “percent ...
Introduction to boosted decision trees - INDICO-FNAL (Indico)
indico.fnal.govDecision/regression trees Learning: Each split at a node is chosen to maximize information gain or minimize entropy Information gain is the difference in entropy before and after the potential split Entropy is max for a 50/50 split and min for a 1/0 split The splits are created recursively
Non-Linear & Logistic Regression
sites.ualberta.caLogistic Regression (a.k.a logit regression) Relationship between a binary response variable and predictor variables • Binary response variable can be considered a class (1 or 0) • Yes or No • Present or Absent • The linear part of the logistic regression equation is used to find the
Introduction to Boosted Trees
web.njit.edu•Model: assuming we have K trees Think: regression tree is a function that maps the attributes to the score •Parameters

Classification: Basic Concepts, Decision Trees, and Model ...
www-users.cse.umn.eduThis is a key characteristic that distinguishes classification from regression, a predictive modeling task in which y is a continuous attribute. Regression techniques are covered in Appendix D. Definition 4.1 (Classification). Classification is the task of learning a tar-get function f that maps each attribute set x to one of the ...