
Interpretation Guide
All figures have been counted according to AOAC® Official Methods of Analysis SM #998.08 and #991.14. The confirmation of E. coli may vary by country. Figure 1 Bubbles The illustrations above show examples of various bubble patterns associated with gas producing colonies. All should be enumerated.
Download Interpretation Guide

Information
Domain:
Source:
Link to this page:
Documents from same domain
3M Fire Barrier Sealant CP 25WB+
multimedia.3m.com3M™ Fire Barrier Sealant CP 25WB+ Product Data Sheet 1. Product Description 3M™ Fire Barrier Sealant CP 25WB+ is a high-performance, ready-to-use, gun-grade, latex-based, intumescent sealant
3M Fire Barrier Sealant FD 150+
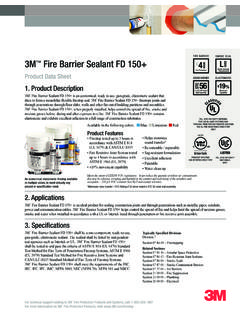
multimedia.3m.com3M™ Fire Barrier Sealant FD 150+ Product Data Sheet 1. Product Description 3M ™ Fire Barrier Sealant FD 150+ is an economical, …
with Pressure-Sensitive Rubber Thermosetting
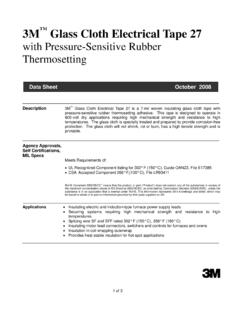
multimedia.3m.com1 of 3 3M™ Glass Cloth Electrical Tape 27 with Pressure-Sensitive Rubber Thermosetting Description 3M™ Glass Cloth Electrical Tape 27 is a 7-mil woven insulating glass cloth tape with
3M Fire Barrier Water Tight Sealant 3000WT L
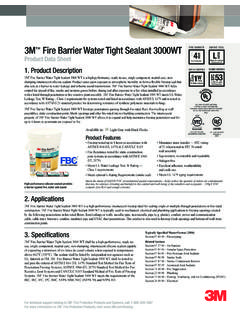
multimedia.3m.com7. Maintenance No maintenance is expected to be required when installed in accordance with the applicable UL, Intertek or other third-party listed system. Once installed, if any section of the 3M
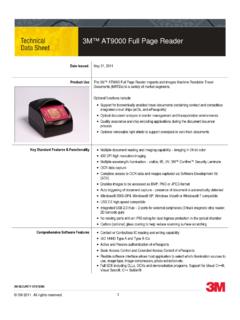
3M™ AT9000 Full Page Reader
multimedia.3m.com3M SECURITY SYSTEMS 2 3M™ AT9000 Full Page Reader © 3M 2011. All rights reserved. Reading Capability The 3M™ AT9000 Full Page Reader reads the following: • ICAO compliant documents in near infrared (IR) per ICAO 9303 specification Parts 1-4
Protection
multimedia.3m.com3M Infrastructure Protection Division www.3M.com/Corrosion 7 Multi-layer Polyolefin Coating Systems Multilayer polyolefin systems consist of a base corrosion protection layer of fusion
Education
multimedia.3m.comUnited States Canada Technical Service 1 800 243-4630 Technical Service 1 800 267-4414 Sales Assistance 1 800 896-4223 Sales Assistance 1 800 265-1840 ext. 6137G12 2000 Resource Guide
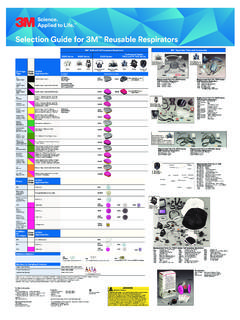
Selection Guide for 3M Reusable Respirators
multimedia.3m.comMulti-Gas/Vapor Certain Organic Vapors, Chlorine, Hydrogen Chloride, Chlorine Dioxide, Sulfur Dioxide,
Document Library TS Data Sheet 08609
multimedia.3m.com1 Document Library TS Data Sheet 08609 Public Rev:3 Status: Active Effective: 09/14/2007 3M™ Windo-Weld™ Super Fast Urethane Data Sheet 3M Part No.(s) 3M …
3M Fire Barrier Duct Wrap 615+
multimedia.3m.com3M™ Fire Barrier Duct Wrap 615+ Product Data Sheet 1. Product Description 3M™ Fire Barrier Duct Wrap 615+ is a flexible fire-resistant wrap consisting of an inorganic fiber blanket encapsulated with a scrim-reinforced foil. The product is 1-1/2 in. thick,
Related documents

17.3.04 D. Analysis AOAC Official Method 991.14 Coliform ...
edgeanalytical.comAOAC Official Method 991.14 Coliform and Escherichia coli Counts in Foods Dry Rehydratable Film (Petrifilmä E. coli/Coliform Count Plateä and Petrifilmä Coliform Count Plateä) Methods First Action 1991 Final Action 1994 See Table 991.14 for the results of the interlaboratory study sup-porting the acceptance of the method. A. Principle
ANNEX G AOAC Official Method 991.43 Total, Soluble, and ...
acnfp.food.gov.ukAOAC OFFICIAL METHODS OF ANALYSIS Supplement March 1995 32.1.17 AOAC Official Method 991.43 Total, Soluble, and Insoluble Dietary Fiber in Foods Enzymatic-Gravimetric Method, MES—TRIS Buffer First Action 1991 Final Action 1994 (Applicable to processed foods, grain and cereal products, fruits, and vegetables.) Method Performance:
Adulteration of honey and available methods for detection ...
actavet.vfu.cz100 litres/colony of HFC-85, and 100 litres/colony of HFC-55. The official methods (AOAC 978. 17 1995; AOAC 991.41 1995; AOAC 998.12 2005) and the internal standards for the detection of carbon isotope ratios are not effective in detecting adulteration of honey made by feeding bees syrups made from C3 plants such as sugarbeet (Beta vulgaris) and

7. ANALYTICAL METHODS
www.atsdr.cdc.govNo data AOAC 1990 (animal) (method : 991.11) Serum and : Separate serum and plasma by Flame AAS ; No data : No data Shaw et al. plasma : centrifugation; keep stored in ; 1982 : glass tubes at -20 °C until ; analysis; thaw to room : temperature prior to analysis
Analysis of Total Fat - cfs.gov.hk
www.cfs.gov.hk8 AOAC official methods Other techniques Meat and poultry Rapid microwave –solvent extraction CH 2 Cl 2 products 985.15 976.21 Meat Rapid specific gravity method C 2 Cl 4 964.12 Seafood Rapid modified babcock method 969.24 Fish meal Semimicro method, extraction apparatus CHCl 3