Learning SAS by Example
Chapter 6 Reading and Wr iting Data from an Excel Spreadsheet 87 6.1 Introduction 87 6.2 Using the Import Wizard to Convert a Spreadsheet to a SAS Data Set 88 6.3 Creating an Excel Spreadsheet from a SAS Data Set 93 6.4 Using an Engine to Read an Excel Spreadsheet 95
Download Learning SAS by Example

Information
Domain:
Source:
Link to this page:
Documents from same domain
SAS Functi ons by Example
www.sas.comSAS ® Functi ons by Example ... Program 4.1: Creating a SAS date value from separate variables ... Examples . For these examples, H = 1, ...

Retail Customer Segmentation - SAS
www.sas.comRetail Customer Segmentation using SAS April 2014 Calgary SAS Users Group meeting Jenny Chen Data Science, LoyaltyOne

Catalyzing Positive Change in Education: The Four …
www.sas.com2 Catalyzing Positive Change in eduCation: the Four Pillars Catalyze Conversations nothing kills our energized embrace of education reform like top-down, do-it-or-we-

Best Practices in Credit Risk Management - SAS
www.sas.comWHITE PAPER Best Practices in Credit Risk Management Challenges to and Opportunities for Rebuilding Trust

Developing Credit Risk Models Using SAS® …
www.sas.com2 Developing Credit Risk Models Using SAS Enterprise Miner and SAS/STAT The remaining chapters are structured as follows: Chapter 2 covers the area of sampling and data pre-processing. This chapter defines and contextualizes issues such as variable selection, missing values, and outlier detection within the area of credit risk modeling…

A Non-Geek’s A-to-Z Guide to the Internet of Things
www.sas.comA Non-Geek’s A-to-Z Guide to the Internet of Things 2 Internet of Things ... A good case in point is big data. ... helping you pick out groceries, ...
PREDICTIVE BUSINESS ANALYTICS
www.sas.comCHAPTER 9 Integration of Business Intelligence, Business Analytics, and Enterprise Performance ... Predictive business analytics leverages data within

e s s I n telli B I A I 2016 d A R C - SAS
www.sas.comAs expected, Advanced Analytics lags behind Business Intelligence in terms of usage across an entire organization. This lag is re"ected in
Conditional Processing in EG - SAS
www.sas.comCopyright © 2013, SAS Institute Inc. All rights reserved. sas.com THANK YOU! Title: Conditional Processing in EG Author: Matt Malczewski Created Date: 4/29/2014 11 ...
h Little SAS Book
www.sas.comThe Little SAS ® Book Lora D. Delwiche and Susan J. Slaughter a primer FIFTH EDITION g h
Related documents
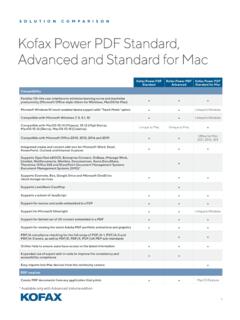
SOLUTION COMPARISON Kofax Power PDF Standard, …
www.kofax.comRetains number formats in Excel (currency, percentage, etc.) • • Retains hyperlinks (.doc, .docx, .wpd, .xls, .xslx) • • Extract tables from a PDF file and place into Excel or Word • • Convert a select area of a page using OCR and convert to Word, Excel, PowerPoint, WordPerfect—for scanned (image) PDF files as well as text-based ...

MATLAB - UiO
www.mn.uio.noii Contents Operating on Diagonal Matrices. . . . . . . . . . . . . . . . . . . . . . .1-39 Constructing a Matrix from a Diagonal Vector . . . . . . . . . . . . 1-39 ...
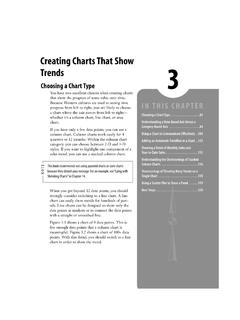
Creating Charts That Show Trends
ptgmedia.pearsoncmg.comshould explicitly check to make sure that Excel is using the correct type of axis. A number of potential problems force Excel to choose a text-based axis instead of a date-based axis, such as dates that are stored as text in a spreadsheet and dates represented by numeric years. (See the list following Figure 3.7 for other potential problems.)

Determination of an Equilibrium Constant
mctcteach.orgSpreadsheet Calculations The calculations required to determine equilibrium constants in this exper iment involve many steps. While it is possible to manually perform these calculations, it requires a lot of time. To save you time, you’ll will be using an Excel spreadsheet to determine Kc values. Spreadsheet calculations also have the

Introduction to Google Docs
www.lfpl.orgSpreadsheet is a spreadsheet program similar to MS Excel. Form is a program for creating web-based surveys and invitations, and which allows you to track responses. Drawing is a program similar to Painting from Accessories in MS Windows. Collections allows you to create new or arrange existing folders for organizing your projects.
(VVHQWLDO 6SUHDGVKHHWV ([HUFLVHV
www.york.ac.ukHint2 WKHUH·VQRPDJLFV SUHDGVKHHW -y way of converting from pence to pounds \RX·UHJRLQJWRKDYH to employ some m aths. b. Re plicate your formula down the column. c. Switch to the MiileageDatatab and in cell B4use a suitable function to total the number of miles recorded in column Dof the MiileageVKHHW <RX·OOQHHGWRHQVXUHWKLVWRW al will