Lecture 5: Estimation
The likelihood is the probability of the data given the parameter and represents the data now available. The prior is the probability of the parameter and represents what was
Download Lecture 5: Estimation

Information
Domain:
Source:
Link to this page:
Documents from same domain
Lecture 10: Multiple Testing - UW Genome Sciences
www.gs.washington.eduWhy Multiple Testing Matters Genomics = Lots of Data = Lots of Hypothesis Tests A typical microarray experiment might result in performing 10000 separate hypothesis tests.
DNA Isolation from Strawberries
www.gs.washington.edusource for extracting DNA because they are easy to pulverize and contain enzymes called pectinases and cellulases that help to break down cell walls. And most important, strawberries have eight copies of each chromosome (they are octoploid), so there is a lot of DNA to isolate. The purpose of each ingredient in the procedure is as follows:
Lecture 10: Multiple Testing
www.gs.washington.eduFalse Discovery Rate m 0 m-m 0 m V S R Called Significant U T m - R Not Called Significant True True Total Null Alternative V = # Type I errors [false positives] •False discovery rate (FDR) is designed to control the proportion of false positives among the set of rejected hypotheses (R)
Lecture 7: Hypothesis Testing and ANOVA
www.gs.washington.edu•Calculate a test statistic in the sample data that is ... candidate gene. We then divide these N individuals into ... Sum of MS F Squares Source of df Variation! SST G k"1! SST E N"k! SST G k"1 SST E N"k. Non-Parametric Alternative • Kruskal-Wallis …
Lecture 4: Random Variables and Distributions
www.gs.washington.edu•Before data is collected, we regard observations as random variables (X 1,X 2,…,X n) •This implies that until data is collected, any function (statistic) of the observations (mean, sd, etc.) is also a random variable •Thus, any statistic, because it is a random variable, has a probability distribution - referred to as a sampling ...
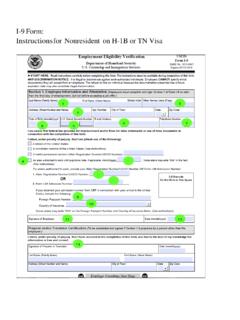
I-9 Form: Instructions for Nonresident on H-1B or TN Visa
www.gs.washington.eduI-9 Form: Instructions for Nonresident on H-1B or TN visa Instructions for both New Hires and Updating & Reverification For more detailed information about completing Form I-9, employers and employees should refer to the Handbook for Employers: Instructions for Completing Form I-9 (M-274). _____
Lecture 9: Linear Regression - University of Washington
www.gs.washington.eduLecture 9: Linear Regression. Goals • Linear regression in R •Estimating parameters and hypothesis testing ... •Previous coding would result in colinearity •Solution is to set up a series of dummy variable. In general for k levels you need k-1 dummy variables x 1 …
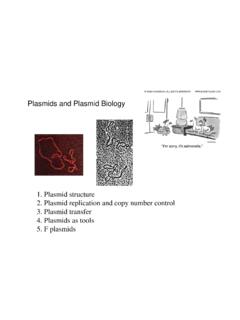
1. Plasmid structure 2. Plasmid replication and copy ...
www.gs.washington.eduPlasmid replication requires host DNA replication machinery. 2. Most wild plasmids carry genes needed for transfer and copy number ... Large or small region of homologous DNA cloned that will integrate into the chromosomal target. 5. Need a counter selection method to kill the donor cells 6. Screen for what you think is correct.
Lecture 2: Descriptive Statistics and Exploratory Data ...
www.gs.washington.eduMultivariate Data •Organize units into clusters •Descriptive, not inferential •Many approaches •“Clusters” always produced Clustering Data Reduction Approaches (PCA) •Reduce n-dimensional dataset into much smaller number •Finds a new (smaller) set of variables that retains most of the information in the total sample
Related documents
Chapter 5: JOINT PROBABILITY DISTRIBUTIONS Part 1 ...
homepage.stat.uiowa.edudescribed with a joint probability mass function. If Xand Yare continuous, this distribution can be described with a joint probability density function. Example: Plastic covers for CDs (Discrete joint pmf) Measurements for the length and width of a rectangular plastic covers for CDs are rounded to the nearest mm(so they are discrete).
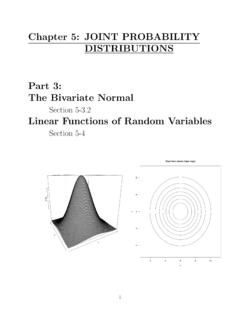
Chapter 5: JOINT PROBABILITY DISTRIBUTIONS Part 3: The ...
homepage.stat.uiowa.eduBivariate Normal Probability Density Function ... tour plot of the joint distribution looks like con-centric circles (or ellipses, if they have di erent variances) with major/minor axes that are par-allel/perpendicular to the x-axis: The center of each circle or …
Strict-Sense and Wide-Sense Stationarity Autocorrelation ...
isl.stanford.edu+sint with probability 1 4 −sint with probability 1 4 +cost with probability 1 4 −cost with probability 1 4 E(X(t)) = 0 and RX(t1,t2) = 1 2 cos(t2 −t1), thus X(t) is WSS But X(0) and X(π 4) do not have the same pmf (different ranges), so the first order pmf is not stationary, and the process is not SSS

Condit Density - Department of Statistics and Data Science
www.stat.yale.eduThe joint density for (X;Y) equals f(x;y) = (2ˇ) 1 exp (x2 + y2)=2. To nd the conditional density for Xgiven R= r, rst I’ll nd the joint density for Xand R, then I’ll calculate its Xmarginal, and then I’ll divide to get the conditional density. A simpler method is described at the end of the Example. We need to calculate Pfx 0 X x 0 + ;r ...
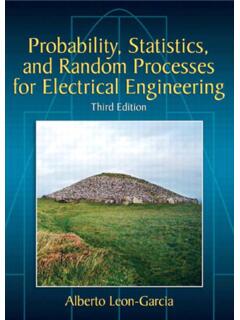
Probability, Statistics, and Random Processes for ...
www.sze.hu4.2 The Probability Density Function 148 4.3 The Expected Value of X 155 4.4 Important Continuous Random Variables 163 4.5 Functions of a Random Variable 174 4.6 The Markov and Chebyshev Inequalities 181 ... 5.3 The Joint cdf of X and Y 242 5.4 The Joint pdf of Two Continuous Random Variables 248
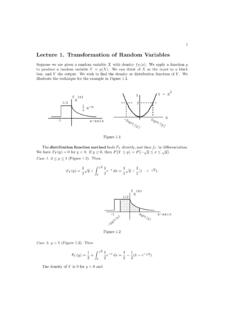
Lecture1.TransformationofRandomVariables
faculty.math.illinois.edu1. The joint density of two random variables X 1 and X 2 is f(x 1,x 2)=2e−x 1e−x 2, where 0 <x 1 <x 2 <∞;f(x 1,x 2) = 0 elsewhere. Consider the transformation Y 1 =2X 1,Y 2 = X 2 −X 1. Find the joint density of Y 1 and Y 2,and conclude thatY 1 and Y 2 are independent. 2. Repeat Problem 1 with the following new data. The joint density is ...
Exam 1 Practice Questions I - MIT OpenCourseWare
ocw.mit.edualways X minutes late, where X is an exponential random variable with probability density function f. X (x) = λe −λx. Suppose that you arrive at the bus stop precisely at noon. (a) Compute the probability that you have to wait for more than five minutes for the bus to arrive. (b) Suppose that you have already waiting for 10 minutes.

LECTURE NOTES on PROBABILITY and STATISTICS Eusebius …
users.encs.concordia.caJoint distributions 150 Marginal density functions 153 Independent continuous random variables 158 Conditional distributions 161 Expectation 163 Variance 169 Covariance 175 Markov’s inequality 181 ... The probability of a sequence to contain precisely two Heads is …
Conditional Joint Distributions
web.stanford.eduA joint probability density functiongives the relative likelihood of more than one continuous random variable each taking on a specific value. < £ < £ = ò ò 2 1 2 1 P(1 2, 1 2) , ( , ) a a b b a X a b Y b f X Y x y dy dx Joint Probability Density Function 0 y x 900 900 0 900 900