Maximum Likelihood Estimation
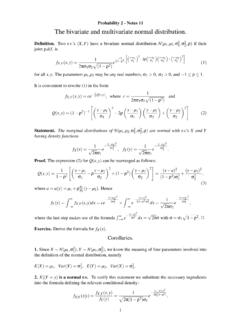
Figure xxx illustrates the normal likelihood for a representative sample of size n=25. Notice that the likelihood has the same bell-shape of a bivariate normal density Suppose σ 2 =1.Then
Download Maximum Likelihood Estimation

Information
Domain:
Source:
Link to this page:
Documents from same domain
What is Marketing? Fundamentals of Marketing …
faculty.washington.eduBalakrishnan S #1 Fundamentals of Marketing Management Managing World-Class Organizations Dr. P.V. (Sundar) Balakrishnan Balakrishnan S #2 What is Marketing?

The Basque Country - University of Washington
faculty.washington.eduTrevor McAllister-Day HONORS 211 C Country Report The Basque Country Introduction The “Basque Country,” or in the Basque lan-guage, Euskal Herria, is a …
The Elements of Style
faculty.washington.eduThe Elements of Style Strunk, W., Jr. and White, E.B. CONTENTS ... The writer's colleagues in the Department of English in Cornell University have greatly helped him in the preparation of his manuscript. Mr. George McLane Wood has kindly consented to the inclusion under Rule 11 of some material from his
Blogging With Photovoice: Sharing Pictures in an ...
faculty.washington.eduLetter to Parents and the Photovoice Project Instructions explaining the assignment and making sure that all students have permission to use the blog you have created. This letter can also help you make certain that all students have access to a camera (see Step 5).
BEAGLE 3.3 - University of Washington
faculty.washington.eduBeagle is used to phase genotype data for unrelated individuals, the input Beagle file contains unphased unrelated data, and the output Beagle file contains phased unrelated data. Input files with phased unrelated data are specified with the phased command line argument (see Section 3.2.1).
Brian L. Browning Department of Medicine Division of ...
faculty.washington.eduBeagle assumes that any input VCF file that has a name ending in “.gz” is compressed with gzip or bgzip, and that any reference file that has a name ending in “bref”VCF is compressed with the program. bref Output VCF, IBD, and HBD files are with compressed
Brainy Word Search Puzzles - University of Washington
faculty.washington.eduParts of the Brain Parts of the Nervous System Lobes of the Brain Cerebral Cortex

From Sage on the Stage to Guide on the Side
faculty.washington.eduFrom Sage on the Stage to Guide on the Side Alison King In most college classrooms, the pro fessor lectures and the students listen and take notes.

An Overview of Economics - University of Washington
faculty.washington.edu2 Preview Economics is one of the oldest and most influential of intellectual disciplines. Practically all of the great thinkers, from Aristotle to Einstein,

Seismology and Earthquake Engineering
faculty.washington.eduand Space Sciences who wish to obtain an introduction to seismology and earthquake engineering. The course covers a wide range of topics. For each topic, the goal of the course is to develop a general understanding of the important issues and a specific
Related documents

Delta Method - University of Western Ontario
fisher.stats.uwo.caidea is the same as used in Theorem 1, but is based on working with bivariate normal distributions, and more generally with multivariate normal distributions. Theorem 3 Suppose the conditions of Theorem 2. Suppose g is a function of two vari-ables mapped to two variables, that is continuous and also has a derivative g′ at ( 1; 2), and that g′(

Stata: Bivariate Statistics
populationsurveyanalysis.comFirst, bivariate statistics are used to compare two study groups to see if they are similar. For example, to compare two groups at baseline before an ... not part of the normal Stata package, we have to manually specify all aspects of the sample design including pweight(), psu(), and …
Probability 2 - Notes 11 The bivariate and multivariate ...
www.maths.qmul.ac.ukThis is just the m.g.f. for the multivariate normal distribution with vector of means Am+b and variance-covariance matrix AVAT. Hence, from the uniqueness of the joint m.g.f, Y » N(Am+b;AVAT). Note that from (2) a subset of the Y0s is multivariate normal. NOTE. The results concerning the vector of means and variance-covariance matrix for linear

Chapter 12 Conditional densities - Yale University
www.stat.yale.edua standard bivariate normal distribution with correlation ˆ= :3. If Sam has a height of S= 74 inches, what would one predict about the ultimate height Tof his young son Tom? For the standard bivariate normal, if the variables are uncorrelated (that is, if ˆ= 0) then the joint density factorizes into the product of two N(0;1)
MATH 545, Stochastic Calculus Problem set 2
services.math.duke.eduA standard bivariate normal distribution is a bivariate normal distribution where the means of both coordinate variables are zero and the covariance matrix is the identity matrix. You can use the fact that any linear combination of random variables following a multi-variate normal distribution has a normal distribution. Let [Z 1 Z
Chapter 3 Random Vectors and Multivariate Normal …
sites.pitt.eduBivariate normal distribution with mean (0,0)T and covariance matrix ... squares of independent normal random variables will be distributed indepen-dently as chi-squares. Chapter 3 94. BIOS 2083 Linear Models Abdus S. Wahed Theorem 3.3.2. If X∼ N
Statistics: 2.3 The Mann-Whitney U Test - statstutor
www.statstutor.ac.uk7. If we use a normal approximation we get: z = U − nxny r 2 n xn y(N +1) 12 = q3−10 50/3 = −1.715 This gives a two-sided p-value of p = 0.09. The exact test and the normal approximation give similar results. We would conclude that there is no real evidence that the age at diagnosis is different for males and females,