
Missing-data imputation
530 MISSING-DATA IMPUTATION 25.1 Missing-data mechanisms To decide how to handle missing data, it is helpful to know why they are missing. We consider four general “missingness mechanisms,” moving from the simplest to
Download Missing-data imputation

Information
Domain:
Source:
Link to this page:
Documents from same domain
Lecture 15 Introduction to Survival Analysis
www.stat.columbia.eduLecture 15 Introduction to Survival Analysis BIOST 515 February 26, 2004 BIOST 515, Lecture 15
Two-way ANOVA and ANCOVA
www.stat.columbia.eduTwo-way ANOVA and ANCOVA In this tutorial we discuss fitting two-way analysis of variance (ANOVA), as well as, analysis of covariance (ANCOVA) models in R.

Multiple Linear Regression - Columbia University
www.stat.columbia.eduMultiple Linear Regression A regression with two or more explanatory variables is called a multiple regression. Rather than modeling the …

Sample size and power calculations - Columbia …
www.stat.columbia.eduCHAPTER 20 Sample size and power calculations 20.1 Choices in the design of data collection Multilevel modeling is typically motivated by features in …

One and Two-sample t-tests - Columbia University
www.stat.columbia.eduOne and Two-sample t-tests The R function t.test() can be used to perform both one and two sample t-tests on vectors of data. The function contains a variety of options and can be called as follows:

Statistics and Research Integrity - Columbia University
www.stat.columbia.eduEuropean Science Editing 13 February 2015; 41(1) Another important challenge was receiving fewer essays from Balkan authors than expected and convincing the referees

Linear Regression - Columbia University
www.stat.columbia.eduLinear Regression In this tutorial we will explore fitting linear regression models using STATA. We will also cover ways of re-expressing variables in a …
The Twentieth-Century Reversal: How Did the …
www.stat.columbia.eduGelman: The Twentieth-Century Reversal: How Did the Republican States Switch to the Democrats and Vice Versa? 3 of, and more …

Abandon Statistical Signi cance - Department of …
www.stat.columbia.eduAbandon Statistical Signi cance Blakeley B. McShane1, David Gal2, Andrew Gelman3, Christian Robert4, and Jennifer L. Tackett1 1Northwestern University, 2University of …

Colors in R - Columbia University
www.stat.columbia.educolor name color name gray8 gray9 gray10 gray11 gray12 gray13 gray14 gray15 gray16 gray17 gray18 gray19 gray20 gray21 gray22 gray23 gray24 gray25 gray26 gray27 gray28
Related documents
Logistic Regression
personal.psu.eduLogistic Regression I The Newton-Raphson step is βnew = βold +(XTWX)−1XT(y −p) = (XTWX)−1XTW(Xβold +W−1(y −p)) = (XTWX)−1XTWz , where z , Xβold +W−1(y −p). I If z is viewed as a response and X is the input matrix, βnew is the solution to a weighted least square problem: βnew ←argmin β (z−Xβ)TW(z−Xβ) . I Recall that linear regression by least square is …
Data, Covariance, and Correlation Matrix
users.stat.umn.eduThe Data Matrix R Code Row and Column Means > # get row means (3 ways) > rowMeans(X)[1:3] Mazda RX4 Mazda RX4 Wag Datsun 710 29.90727 29.98136 23.59818
The Adaptive Lasso and Its Oracle Properties
users.stat.umn.eduof Minnesota, Minneapolis, MN 55455 (E-mail: hzou@stat.umn.edu ). The au-thor thanks an associate editor and three referees for their helpful comments and suggestions. Sincere thanks also go to a co-editor for his encouragement. high variability and in addition is often trapped into a local op-timal solution rather than the global optimal solution.

Principal Component Analysis - Columbia University
www.stat.columbia.eduPCA in a nutshell Notation I x is a vector of p random variables I k is a vector of p constants I 0 k x = P p j=1 kjx j Procedural description I Find linear function of x, 0 1x with maximum variance. I Next nd another linear function of x, 0 2x, uncorrelated with 0 1x maximum variance. I Iterate. Goal It is hoped, in general, that most of the variation in x will be
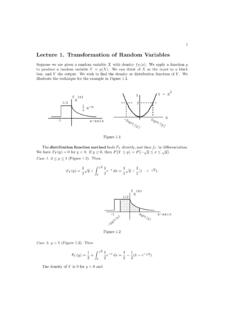
Lecture1.TransformationofRandomVariables
faculty.math.illinois.edu7 2.3ATypicalApplication Let Xand Ybe independent,positive random variables with densitiesf X and f Y,and let Z= XY.We find the density of Zby introducing a new random variable W,as follows: Z= XY, W= Y (W= Xwould be equally good).The transformation is one-to-one because we can solve for X,Yin terms of Z,Wby X= Z/W,Y= W.In a problem of this type,we must always
Generalized Estimating Equations - SAS
support.sas.comSAS/STAT software provides two procedures that enable you to perform GEE analysis: the GENMOD procedure and the GEE procedure. Both procedures implement the standard generalized estimating equation approach for longitudinal data; this approach is appropriate for complete data or when data are missing completely

Type I and Type II errors - Department of Statistics
www.stat.berkeley.eduThe q-value is defined to be the FDR analogue of the p-value. The q-value of an individual hypothesis test is the minimum FDR at which the test may be called significant.
1 Why is multiple testing a problem?
www.stat.berkeley.edumgoldman@stat.berkeley.edu O ce Hours: 342 Evans M 10-11, Th 3-4, and by appointment 1 Why is multiple testing a problem? Say you have a set of hypotheses that you wish to test simultaneously. The rst idea that might come to mind is to test each hypothesis separately, using some level of signi cance .