
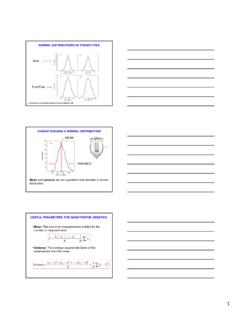
Normal Distributions
The standard Normal curve is the normal curve with mean = 0 and standard deviation ˙= 1. We will see later how probabilities for any normal curve can be recast as probabilities for the standard normal curve. For the standard normal, probabilities are computed either by means of a computer/calculator of via a table.
Download Normal Distributions

Information
Domain:
Source:
Link to this page:
Documents from same domain

WIRELESS COMMUNICATIONS AND NETWORKS
www3.nd.eduWIRELESS COMMUNICATIONS AND NETWORKS WILLIAM STALLINGS The book by William Stallings offers extensive coverage in the area of Wireless Networks. It does not assume any previous knowledge in the fields of Information
CSE 30321 – Computer Architecture I – Fall 2010 …
www3.nd.eduName:_____ CSE 30321 – Computer Architecture I – Fall 2010 Final Exam December 13, 2010 Test Guidelines: 1. Place your name on …
In:Introduction to Quantitative Genetics Falconer …
www3.nd.edu1 NORMAL DISTRIBUTIONS OF PHENOTYPES Mice Fruit Flies In:Introduction to Quantitative Genetics Falconer & Mackay 1996 CHARACTERIZING A NORMAL DISTRIBUTION Meanand variance are two quantities that describe a normal
Angels and Demons - nd.edu
www3.nd.eduIn the First Part of the Summa St. Thomas deals with angels and demons in two separate places: first, ... So the angels are, like God, immaterial substances.
Math 30210 --- Introduction to operations research
www3.nd.eduMath 30210 --- Introduction to operations research University of Notre Dame, Fall 2007 http://www.nd.edu/~dgalvin1/30210/ Course arrangements
Math 30210 — Introduction to Operations Research
www3.nd.eduMath 30210 — Introduction to Operations Research Assignment 1 (50 points total) Due before class, Wednesday September 5, 2007 Instructions: Please present your answers neatly and legibly.
Statistics in Business Course Syllabus
www3.nd.eduStatistics in Business Course Syllabus Information ... widely used business statistics series and is highly regarded in the eld. ... Exam 2 (i.e., the Final Exam) ...
HOW TO WRITE AN EFFECTIVE RESEARCH PAPER
www3.nd.eduHOW TO WRITE AN EFFECTIVE RESEARCH PAPER ... • Add 2-3 paragraphs that discuss previous work. ... good presentation with proper usage of English

LECTURENOTESON GASDYNAMICS - University of …
www3.nd.eduLECTURENOTESON GASDYNAMICS ... These are a set of class notes for a gas dynamics/viscous flow course taught to juniors in ... • solid mechanics

BaseTech 1 Introducing Basic Network Concepts
www3.nd.edu1 Introducing Basic Network Concepts “In the beginning, there were no networks. ... Networking computers first and tracking the connections later can quickly
Related documents
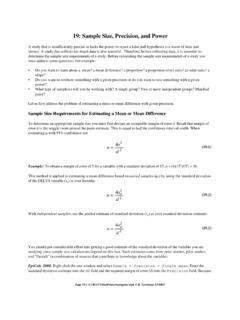
19: Sample Size, Precision, and Power
www.sjsu.eduwhere ∆ denotes the expected mean difference (or difference worth detecting), n denotes the per group sample size, and σ denotes the standard deviation of the variable (e.g., s, s d, s pooled, s w, etc., depending on your sampling scheme). Example: A study of 30 pairs expects a mean difference of 2. The standard deviation of the paired ...
Exercises
www0.gsb.columbia.eduFinance: mean = 25, standard deviation = 2 Marketing: mean = 75, standard deviation = 12 Correlation between score in Finance and same student’s score in Marketing = 0.84 Mary, a student in Cluster Ψ, scored a 30 in Finance and a 90 in Marketing.We are interested in comparing her performance on the two exams relative to the rest of the
Normal Distribution, Confidence Intervals for the Mean ...
webspace.ship.eduFor example: We have a sample that has a mean of 8 and a standard deviation of 2.53. What is the z-score of an observation from this data set that has a value of 13? Therefore, a value of 13 in this data set is 1.98 standard deviations from the mean. We can use the z-table to find out the probability of picking a number >= 13 from this data set.
What is Inferential Statistics? - PSY 225: Research Methods
online225.psych.wisc.eduSample mean Sample standard deviation Making a bar chart or boxplot Describing the shape of the sample probability distribution. A bar graph is one way to summarize data in descriptive statistics. Source: NIH.GOV. With inferential statistics …
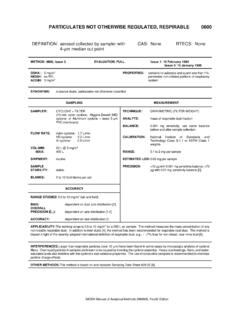
PARTICULATES NOT OTHERWISE REGULATED, RESPIRABLE 0600
www.cdc.govreplicates and record relative standard deviation (S r) on control charts. Take corrective action when the precision is out of control [8]. MEASUREMENT: 11. Weigh each filter, including field blanks. Record this post-sampling weight, W 2 (mg), beside its corresponding tare weight.

Student's t-distribution
www.eecs.yorku.caIn most such problems, if the standard deviation of the errors were known, a normal distribution would be used instead of the t-distribution. Confidence intervals and hypothesis tests are two statistical procedures in which the quantiles of the sampling distribution of a particular statistic (e.g. the standard score) are required.
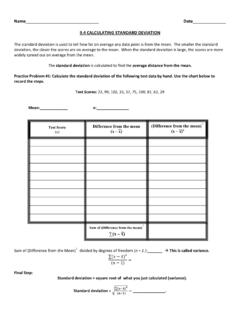
CALCULATING STANDARD DEVIATION WORKSHEET
www.dvusd.orgFor the following sets of data, calculate the mean and standard deviation of the data. Describe the mean and standard deviation in words after calculating it. a. The data set below gives the prices (in dollars) of cordless phones at an electronics store. 35, 50, 60, 60, 75, 65, 80 b.
Standard Practice for Using Significant Digits in Test Data ...
www.galvanizeit.com3.1.3 repeatability standard deviation (s r), n—the standard deviation of test results obtained under repeatability conditions. E177 3.1.4 significant digit—any of the figures 0 through 9 that is used with its place value to denote a numerical quantity to some desired approximation, excepting all leading zeros and