
Ordered Logit Models
Ordinal Regression . As Menard notes, when dependent variables are measured on an ordinal scale, there are many options for their analysis. These include • Treating the variable as though it were continuous. In this case, just use OLS regression or the other techniques we have discussed for continuous variables. Certainly, this is
Download Ordered Logit Models

Information
Domain:
Source:
Link to this page:
Documents from same domain
WIRELESS COMMUNICATIONS AND NETWORKS
www3.nd.eduWIRELESS COMMUNICATIONS AND NETWORKS WILLIAM STALLINGS The book by William Stallings offers extensive coverage in the area of Wireless Networks. It does not assume any previous knowledge in the fields of Information
CSE 30321 – Computer Architecture I – Fall 2010 …
www3.nd.eduName:_____ CSE 30321 – Computer Architecture I – Fall 2010 Final Exam December 13, 2010 Test Guidelines: 1. Place your name on …
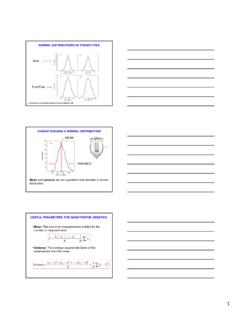
In:Introduction to Quantitative Genetics Falconer …
www3.nd.edu1 NORMAL DISTRIBUTIONS OF PHENOTYPES Mice Fruit Flies In:Introduction to Quantitative Genetics Falconer & Mackay 1996 CHARACTERIZING A NORMAL DISTRIBUTION Meanand variance are two quantities that describe a normal
Angels and Demons - nd.edu
www3.nd.eduIn the First Part of the Summa St. Thomas deals with angels and demons in two separate places: first, ... So the angels are, like God, immaterial substances.
Math 30210 --- Introduction to operations research
www3.nd.eduMath 30210 --- Introduction to operations research University of Notre Dame, Fall 2007 http://www.nd.edu/~dgalvin1/30210/ Course arrangements
Math 30210 — Introduction to Operations Research
www3.nd.eduMath 30210 — Introduction to Operations Research Assignment 1 (50 points total) Due before class, Wednesday September 5, 2007 Instructions: Please present your answers neatly and legibly.
Statistics in Business Course Syllabus
www3.nd.eduStatistics in Business Course Syllabus Information ... widely used business statistics series and is highly regarded in the eld. ... Exam 2 (i.e., the Final Exam) ...

HOW TO WRITE AN EFFECTIVE RESEARCH PAPER
www3.nd.eduHOW TO WRITE AN EFFECTIVE RESEARCH PAPER ... • Add 2-3 paragraphs that discuss previous work. ... good presentation with proper usage of English

LECTURENOTESON GASDYNAMICS - University of …
www3.nd.eduLECTURENOTESON GASDYNAMICS ... These are a set of class notes for a gas dynamics/viscous flow course taught to juniors in ... • solid mechanics
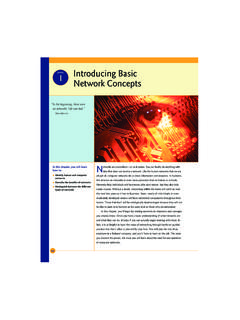
BaseTech 1 Introducing Basic Network Concepts
www3.nd.edu1 Introducing Basic Network Concepts “In the beginning, there were no networks. ... Networking computers first and tracking the connections later can quickly
Related documents
Ordinal Logistic Regression models and Statistical ...
cscu.cornell.eduapplied after an ordinal logistic model provides one method for testing the assumption of proportional odds. In R, the nominal_test() function in the ordinal package can be used to test this assumption. SAS includes the test for the proportional odds assumption automatically in the output, as does SPSS’s ordinal regression menu.

Logistic Regression and Discriminant Analysis
education.uky.eduThe basic idea of regression is to build a model from the observed data and use the model build to explain the relationship be\൴ween predictors and outcome variables. For logistic regression, what we draw from the observed data is a model used to predict 對group membership.
Quantitative Data Analysis: Choosing Between SPSS, PLS and ...
iijsr.orgAltman, 2015). However, Logistic Regression analysis, Multinomial Regression analysis, or Discriminant Analysis are the preferred methods if the nature of dependent variable is a category variable (Johnson and Wichern, 2007; Tabachnick and Fidell, 2007; Field, 2009; Hair et al., 2010). In the context of Discriminant
Using Logistic Regression: A Case Study
www.craftonhills.eduRegression Logistic regression models are used to predict dichotomous outcomes (e.g.: success/non-success) Many of our dependent variables of interest are well suited for dichotomous analysis Logistic regression is standard in packages like SAS, STATA, R, and SPSS Allows for more holistic understanding of student behavior
Ordinal regression in SPSS - University of Sheffield
www.sheffield.ac.ukOrdinal regression in SPSS Output Model Fitting Information Model -2 Log Likelihood Chi-Square df Sig. Intercept Only 557.272 Final 533.091 24.180 3 .000 Link function: Logit. The p-value of less than 0.001 shows that the model is a very good finding on how well does the model fits the data. Goodness-of-Fit Chi-Square df Sig.

ANALYSING LIKERT SCALE/TYPE DATA.
www.st-andrews.ac.ukregression procedures 4. Design considerations. The data analysis decision for Likert items should be made at the questionnaire development stage. If you have a series of individual questions that have Likert response options for your participants to answer - then analyze them as Likert-type items i.e. Modes, medians, and frequencies.