Transcription of Ordinal regression in SPSS - University of Sheffield
1 Ordinal regression Author: Basile Marquier Date Amended: 15/04/2019 Basile Marquier University of Sheffield Ordinal regression in spss Dependent (outcome) variable: Ordinal Independent (explanatory) variables: Continuous (scale) and/or Categorical Common Applications: regression is used to (a) look for significant relationships between two variables or (b) predict a value of one variable for a given value of the other.
2 Data: The data set looks at factors that influence the decision of whether to apply to graduate school. College juniors are asked if they are unlikely, somewhat likely, or very likely to apply to graduate school. Hence, our outcome variable has three categories. College juniors are asked if they are unlikely, somewhat likely, or very likely to apply to graduate school. Hence, our outcome variable has three categories. Data on parental educational status, whether the undergraduate institution is public or private, and current GPA is also collected.
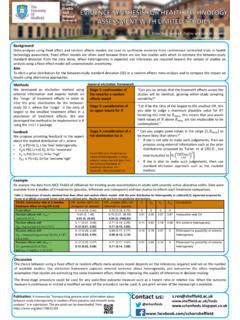
3 Assumptions for Ordinal regression Assumptions How to check Proportional Odds Test of parallel lines Steps in spss Analyze regression Ordinal Move Decision to apply to the Dependent box. The categorical independent variables Education of parents and Private or Public institution should be moved to the Factor(s) box. The scale independent variable GPA score should be moved to Covariate(s) box. We will keep the default options: The following resources are associated: spss dataset Ordinal regression in spss We will tick Test of parallel lines as it will check the assumption of proportional odds.
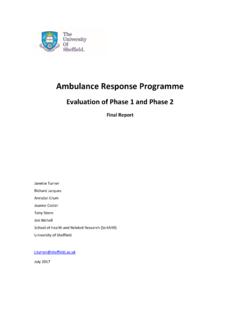
4 Ordinal regression in spss Output Model Fitting Information Model -2 Log Likelihood Chi-Square df Sig. Intercept Only Final 3 .000 Link function: Logit. The p-value of less than shows that the model is a very good finding on how well does the model fits the data. Goodness-of-Fit Chi-Square df Sig. Pearson 435 .878 Deviance 435 .879 Link function: Logit. For this table, we would like to fail to reject the null hypothesis in order for our model to be a good fit.
5 There are two tests (Pearson and Deviance). Both reject the null hypothesis. Test of Parallel Linesa Model -2 Log Likelihood Chi-Square df Sig. Null Hypothesis General 3 .260 The null hypothesis states that the location parameters (slope coefficients) are the same across response categories. a. Link function: Logit. This tests the assumption of proportional odds and we want it to be greater than This is the case here (p-value = ). The main assumption of the Ordinal regression is checked. Ordinal regression in spss Parameter Estimates Estimate Std.
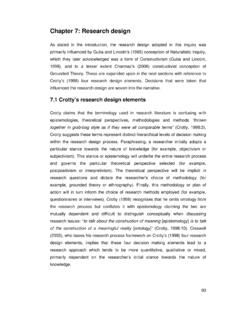
6 Error Wald df Sig. 95% Confidence Interval Lower Bound Upper Bound Threshold [apply = 1] .939 1 .196 [apply = 2] .952 1 .001 Location gpa .616 .263 1 .019 .101 [pared=.00] .268 1 .000 [pared= ] 0a .. 0 .. [public=.00] .059 .289 .041 1 .839 .624 [public= ] 0a .. 0 .. Link function: Logit. a. This parameter is set to zero because it is redundant. The most interesting aspect is the locations. We have a statistically significant result for GPA score (p-value = ). We also have a statistically significant result for variable pared (p-value < ).
7 On the other hand, the fact that the undergraduate institution is public or private does not have any statistically significant impact on the dependent variable apply . The value of the GPA coefficient is positive ( ), which suggests that as GPA increases the likelihood of applying to a graduate school will increase. The value of [pared=0] is negative ( ), which suggests that if you are in the category pared=0 , no parents have a degree, you are less likely to apply to a graduate school.