
Scatter Diagrams Correlation Classifications
Use the minitab regression output for the manatee example to predict the expected number of manatees killed when the number of power boat registrations is 850,000 (x = 85) Chapter 5 # 48 Regression Output • The sample regression equation is: ManateesKilled = -112.7 + 2.27(boats) • So: ManateesKilled = -112.7 + 2.27(85) = 80.25
Download Scatter Diagrams Correlation Classifications

Information
Domain:
Source:
Link to this page:
Documents from same domain

Paired t-test Example Solutions - Colorado State University
www.stat.colostate.eduPaired t-test Example Solutions Rick Gumina STCC201 Paired_t-test_xmp_sol.doc 5) The decision graphic is: 6) The statistical decision is: Reject Ho 7) The English interpretation is: At a significance level of 0.025 there is enough evidence to support the claim that living in a minority environment leads to higher scores on the attitudinal survey.
Normal Probabilites Practice Solution
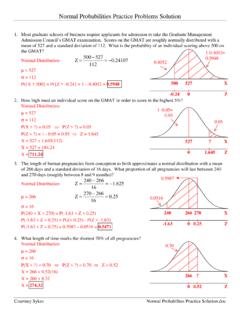
www.stat.colostate.eduNormal Probabilities Practice Problems Solution Courtney Sykes Normal Probabilites Practice Solution.doc 1. Most graduate schools of business require applicants for admission to take the Graduate Management Admission Council’s GMAT examination. Scores on the GMAT are roughly normally distributed with a
t critical values - Colorado State University
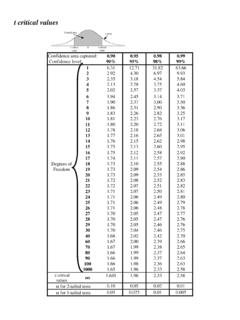
www.stat.colostate.edu0 t critical value-t critical value t curve Central area t critical values Confidence area captured: 0.90 0.95 0.98 0.99 Confidence level: 90% 95% 98% 99%
Correlation and Regression Example solutions
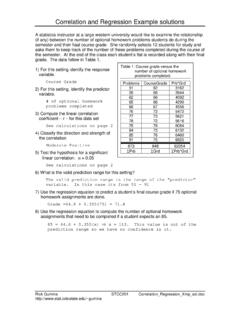
www.stat.colostate.eduRegression Analysis: CourseGrade versus Problems The regression equation is CourseGrade = 44.8 + 0.355 Problems Predictor Coef SE Coef T P Constant 44.827 4.344 10.32 0.000 Problems 0.35519 0.05898 6.02 0.000 S = 2.346 R-Sq = 78.4% R-Sq(adj) = 76.2% Figure 1: Regression plot for the grade versus homework study ...
Related documents
Getting Started with Minitab Statistical Software
www.minitab.com1. Introduction Overview Getting Started with Minitab Statistical Software introduces you to some of the most commonly used features and tasks in Minitab. Note : Some features in this guide are only available in the desktop app . When you use the web app , you can open the desktop app to access

Chapter 2 Simple Comparative Experiments Solutions - umu.se
www.acc.umu.seMinitab Output T-Test of the Mean Test of mu = 120.00 vs mu > 120.00 ... 2-10 Two types of plastic are suitable for use by an electronic calculator manufacturer. The breaking strength of this plastic is important. It is known that V1 = V2 = 1.0 psi. From random samples of n1 = 10
simpleR Using R for Introductory Statistics
cran.r-project.orgThese notes describe how to use Rwhile learning introductory statistics. The purpose is to allowthis ne software to be used in "lower-level" courses where often MINITAB, SPSS, Excel, etc. are used. It is expected that the reader has had at least a pre-calculus course. It is the hope, that students shown how to use Rat this early level will better

2-Sample t-Test - Minitab
support.minitab.comThis paper explains the research conducted by Minitab statisticians to develop the methods and data checks used in the Assistant in Minitab Statistical Software. 2-Sample t-Test Overview A 2-sample t-test can be used to compare whether two independent groups differ. This test is

MINITAB Tutorial - GitHub Pages
lasanthiwatagoda.github.io1. MINITAB Windows Environment Upon entering into a MINITAB session, you will see a screen similar to Figure 1. The bottom portion of the screen is an empty spreadsheet—called a MINITAB worksheet—with columns representing variables and rows representing observa-tions (or cases). The very top of the screen is the MINITAB main menu bar, with

TIME SERIES REGRESSION - University of Delaware
www1.udel.edua) We’ll use the year 1971, the beginning of the first postwar American “energy” crisis. b) What impact did it have on imports? 3. We can compare the before and after levels using usual methods such as difference of means procedures and tests or analysis of variance. i. Recall that analysis of variance allows one to compare and test for

Regression Analysis: A Complete Example - University of Idaho
www.webpages.uidaho.eduWelcome to Minitab, press F1 for help. Regression Analysis: Premium y versus Experience x The regression equation is Premium y = 76.7 - 1.55 Experience x Predictor Coef SE Coef T P Constant 76.660 6.961 11.01 0.000 Experience x -1.5476 0.5270 -2.94 0.026 S = 10.3199 R-Sq = 59.0% R-Sq(adj) = 52.1%