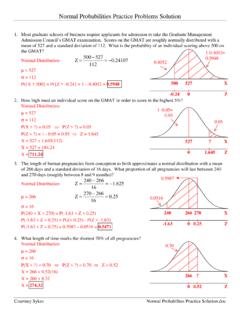
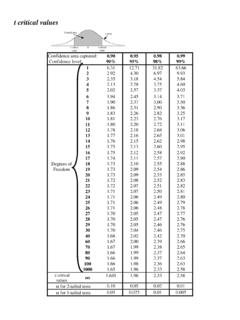
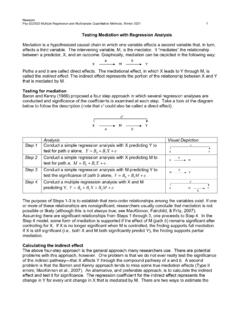
Transcription of Correlation and Regression Example solutions
1 Correlation and Regression Example solutions A statistics instructor at a large western university would like to examine the relationship (if any) between the number of optional homework problems students do during the semester and their fiaal course grade. She randomly selects 12 students for study and asks them to keep track of the number of these problems completed during the course of the semester. At the end of the class each student's ttal is recorded along with their final grade. The data follow in Table 1. Table 1: Course grade versus the 1) For this setting identify the response number of optional homework variable. problems completed. Course Grade Problems CourseGrade Prb*Grd 2) For this setting, identify the predictor 51 62 3162. variable. 58 68 3944. 62 66 4092. # of optional homework 65 66 4290. problems completed 68 67 4556. 76 72 5472. 3) Compute the linear Correlation 77 73 5621. coefficient r for this data set 78 72 5616. See calculations on page 2 78 78 6084.
2 84 73 6132. 4) Classify the direction and strength of 85 76 6460. the Correlation 91 75 6825. Moderate Positive 873 848 62254. 5) Test the hypothesis for a significant Prb Grd Prb*Grd linear Correlation . = See calculations on page 2. 6) What is the valid prediction range for this setting? The valid prediction range is the range of the predictor . variable. In this case its from 51 - 91. 7) Use the Regression equation to predict a student's final course grade if 75 optional homework assignments are done. Grade = + (75) = 8) Use the Regression equation to compute the number of optional homework assignments that need to be completed if a student expects an 85. 85 = + (x) x 113. This value is out of the prediction range so we have no confidence in it. Rick Gumina STCC201 ~gumina Correlation and Regression Example solutions 3) Calculations for problem 3. n (xy ) x y r=. n (n 1)s x sy 12(62254 ) (873 )(848 ). =. 12(11)( )( ). = 5) Hypothesis test for significant linear Correlation A) Ho: = 0.
3 Ha: 0. B) = ; df = 10; tcrit = C). r t calc =. 1 r 2. n 2. =. 1 ( ). 2. 10. = D) The decision graphic E) Reject Ho F) At a significance level of we can conclude that there is a significant linear Correlation between the number of homework assignments and a student's final grade. Furthermore, we can conclude that this Correlation is +. Rick Gumina STCC201 ~gumina Correlation and Regression Example solutions Output 1: Descriptive statistics for the grade versus homework study Descriptive Statistics: Problems, CourseGrade Variable N Mean Median TrMean StDev SE Mean Problems 12 CourseGr 12 Variable Minimum Maximum Q1 Q3. Problems CourseGr Output 2: Regression output for the grade versus homework study Regression analysis : CourseGrade versus Problems The Regression equation is CourseGrade = + Problems Predictor Coef SE Coef T P. Constant Problems S = R-Sq = R-Sq(adj) = Figure 1: Regression plot for the grade versus homework study Rick Gumina STCC201 ~gumina