Example: confidence
THE NHSN STANDARDIZED UTILIZATION RATIO (SUR)
The logistic regression model is the specific type of model that adjusts for factors significantly associated with NICU central line (CL) device use. At a high level, the model uses a set of fixed parameters (adjustment variables
Tags:
Information
Domain:
Source:
Link to this page:
Documents from same domain

School Chemistry Laboratory Safety Guide
www.cdc.govSchool Chemistry Laboratory Safety Guide. October 2006. U.S. Consumer Safety Product Commission DEPARTMENT OF HEALTH AND HUMAN SERVICES. Centers for Disease Control and Prevention

Biosafety in Microbiological and Biomedical …
www.cdc.goviii. Foreword. Biosafety in Microbiological and Biomedical Laboratories (BMBL) quickly became the cornerstone of biosafety practice and policy in the United States upon first

Sobering Facts: Drunk Driving in Georgia
www.cdc.govSobering Facts: Drunk Driving in GEORGIA Keep Georgia safe. Keep drunk drivers off the road. This fact sheet provides a snapshot of alcohol-involved deaths and drunk driving

ALCOHOLS III 1402
www.cdc.govALCOHOLS III: METHOD 1402, Issue 2, dated 15 August 1994 - Page 3 of 4 a. Remove and discard back sorbent section of a media blank sampler. b. Inject a known amount of analyte or DE stock solution directly onto front sorbent section

Fast Facts
www.cdc.govAny person working outdoors is at risk of exposure to poisonous plants, such as poison ivy, poison oak, and poison sumac. When in contact with skin, the sap oil (urushiol) of

Trans Fat: The Facts
www.cdc.gov• Read the Nutrition Facts label and ingredient list to compare foods. » Choose products with 0 grams trans fat. » Check the Ingredient List to see if there is any partially hydrogenated oil in the product.

ANTIBIOTIC RESISTANCE THREATS
www.cdc.govApr 23, 2013 · 6. ANTIBIOTIC RESISTANCE THREATS IN THE UNITED STATES, 2013. Executive Summary. Antibiotic Resistance Threats in the United States, 2013. is a snapshot of the complex problem

Chlorine Residual Testing
www.cdc.govChlorine Residual Testing Fact Sheet, CDC SWS Project 4 Methods to Test Free Chlorine in the Field in Developing Countries There are three main methods to test free chlorine residual in drinking water in the field

2018 Combined Recommended Immunization …
www.cdc.govRecommended Immunization Schedule for Children and Adolescents Aged 18 Years or Younger, UNITED STATES, 2018 Approved by the Advisory Committee on …

Traveling? Make Sure You Protect Yourself from …
www.cdc.govCS26201 Malaria transmission occurs throughout Malaria transmission occurs in some parts Malaria transmission is not known to occur Center for Global Health
Related documents
Multiple Linear Regression - Johns Hopkins University
blackboard.jhu.edumultiple linear regression analysis. Review of lecture two weeks ago • Linear regression assumes a linear relationship between independent variable(s) and dependent variable • Linear regression allows us to predict an outcome based on one or several predictors
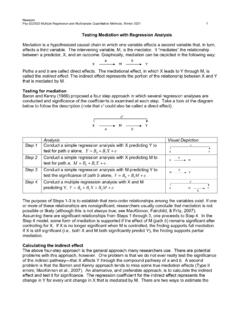
Testing Mediation with Regression Analysis
web.pdx.eduPsy 522/622 Multiple Regression and Multivariate Quantitative Methods, Winter 2021 1 . Testing Mediation with Regression Analysis . Mediation is a hypothesized causal chain in which one variable affects a second variable that, in turn, affects a third variable. The intervening variable, M, is the mediator. It “mediates” the relationship
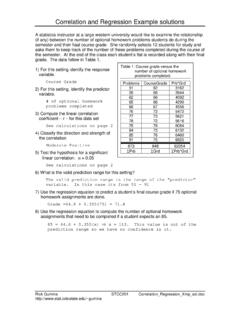
Correlation and Regression Example solutions
www.stat.colostate.eduRegression Analysis: CourseGrade versus Problems The regression equation is CourseGrade = 44.8 + 0.355 Problems Predictor Coef SE Coef T P Constant 44.827 4.344 10.32 0.000 Problems 0.35519 0.05898 6.02 0.000 S = 2.346 R-Sq = 78.4% R-Sq(adj) = 76.2% Figure 1: Regression plot for the grade versus homework study ...
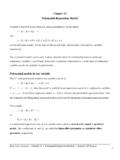
Chapter 12 Polynomial Regression Models - IIT Kanpur
home.iitk.ac.inRegression Analysis | Chapter 12 | Polynomial Regression Models | Shalabh, IIT Kanpur 2 The interpretation of parameter 0 is 0 E()y when x 0 and it can be included in the model provided the range of data includes x 0. If x 0 is not included, then 0 has no interpretation. An example of the quadratic model is like as follows: The polynomial models can be used to approximate a …
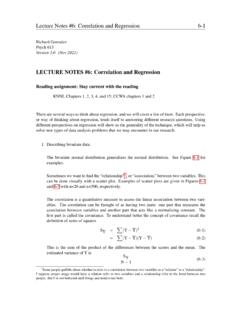
LECTURE NOTES #6: Correlation and Regression
www-personal.umich.eduor way of thinking about regression, lends itself to answering different research questions. Using different perspectives on regression will show us the generality of the technique, which will help us solve new types of data analysis problems that we may encounter in our research. 1.Describing bivariate data.
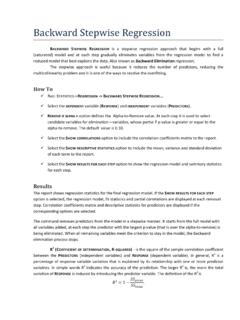
Backward Stepwise Regression - StatPlus
www.analystsoft.comBackward Stepwise Regression BACKWARD STEPWISE REGRESSION is a stepwise regression approach that begins with a full (saturated) model and at each step gradually eliminates variables from the regression model to find a reduced model that best explains the data. Also known as Backward Elimination regression.

Regression Analysis with Cross-Sectional Data
www.swlearning.comregression analysis, including advanced functional form issues, data scaling, prediction, and goodness-of-fit. Chapter 7 explains how qualitative information can be incorporated into multiple regression models. Chapter 8 illustrates how to test for and correct the problem of heteroskedasticity, or
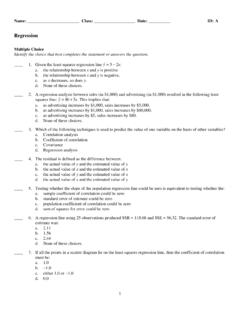
Regression Analysis - GitHub Pages
juejung.github.ioa. Correlation analysis b. Coefficient of correlation c. Covariance d. Regression analysis ____ 4. The residual is defined as the difference between: a. the actual value of y and the estimated value of y b. the actual value of x and the estimated value of x c. the actual value of y and the estimated value of x d. the actual value of x and the ...

Bland-Altman Plot and Analysis - NCSS
ncss-wpengine.netdna-ssl.comand Analysis Introduction The Bland-Altman (mean-difference or limits of agreement) plot and analysis is used to compare two measurements of the same variable. That is, it is a method comparison technique. For example, an expensive measurement system might be compared with a less expensive one or an intrusive measurement system might be