Section 2.1 – Solving Linear Programming Problems
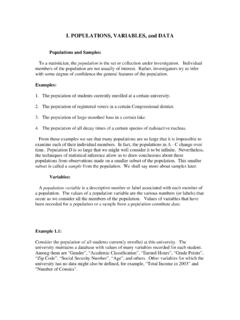
Math 1313 Page 6 of 19 Section 2.1 Example 4: Use the graphical method to solve the following linear programming problem. Maximize R x y= +4 11 subject to: 3 2 4 0 0 x y x y x y + ≤ + ≤ ≥ ≥ Solution: We need to graph the system of inequalities to produce the feasible set. We will start
Download Section 2.1 – Solving Linear Programming Problems

Information
Domain:
Source:
Link to this page:
Documents from same domain
Probability and Statistics Vocabulary List …
online.math.uh.eduProb & Stat Vocab Probability and Statistics Vocabulary List (Definitions for Middle School Teachers) B • Bar graph – a diagram representing the frequency distribution for nominal or discrete data. It consists of a sequence of bars, or rectangles, corresponding to the possible values, and the
SURFACE AREA AND VOLUME - University of Houston
online.math.uh.eduThe lateral area of the triangular prism is the sum of the areas of the lateral faces; i.e. the sum of the areas of the three rectangles. Lateral Area =+ + =++=3 6 4 6 5 6 18 24 30 72() ()( ) cm2 The total surface area of the triangular prism is the lateral area plus the area of the two
Definition of a Function and Evaluating a Function Domain ...
online.math.uh.eduSECTION 1.1 An Introduction to Functions MATH 1330 Precalculus 1 Chapter 1 A Review of Functions Section 1.1: An Introduction to Functions Definition of a Function and Evaluating a Function

Algebra Vocabulary List (Definitions for Middle School ...
online.math.uh.edu•Arithmetic Sequence (arithmetic progression) – A sequence of numbers in which the difference of two consecutive terms is the same. A sequence with a general
I. POPULATIONS, VARIABLES, and DATA - University of …
online.math.uh.eduuniversity maintains a database with values of many variables recorded for each student. ... automobile accidents on Interstate 10 can be given in miles west from downtown San Antonio or from downtown Houston. No matter which reference point we
Irrational Numbers - University of Houston
online.math.uh.eduD. Approximating Square Roots 1. We will first use the graph of yx= to approximate square roots.To graph yx= , let us first make a chart with a few x and y values: If we plot the above points and then draw a smooth curve through them, we obtain the
Section 1.4 – Graphs of Linear Inequalities
online.math.uh.eduThe solution set to a system of linear inequalities is the set of all ordered pairs that satisfies all of the inequalities. We solve these systems by graphing. To graph a system of linear inequalities, we graph each inequality (using techniques from previous examples in this section) and then find
Exercise Set 2.5: Average Rate of Change
online.math.uh.eduA. Find the average rate of change of velocity for each ten second interval. B. During which interval was the average rate of change the highest? C. Use the average rate of change from10 seconds to 20 seconds to approximate the skydiver’s velocity 19 seconds into free fall. D. Use the average rate of change from 0 ...
Interval Notation and Linear Inequalities - Section 1.7 ...
online.math.uh.eduExercise Set 1.7: Interval Notation and Linear Inequalities 94 University of Houston Department of Mathematics For each of the following inequalities: (a) Write the inequality algebraically. (b) Graph the inequality on the real number line. (c) Write the inequality in interval notation. 1. x is greater than 5. 2. x is less than 4.
SOLIDS, NETS, AND CROSS SECTIONS
online.math.uh.eduImagine being able to “unfold” each of the solids below, and draw a possible net for each solid. Assume that all bases are regular polygons. (If a manipulative such as Polydrons is available, build these solids and then “unfold” them to see what each net looks like.) 1. 2. 3. Net A net is a two-dimensional pattern for a solid.
Related documents
Solving Systems of Linear Equations Using Matrices
78bbm3rv7ks4b6i8j3cuklc1-wpengine.netdna-ssl.comThe solution to the system of equations is (3,7,8). An alternative method, the Gauss-Jordan elimination method, can be used to solve the system of ... Provided by the Academic Center for Excellence 7 Solving Systems of Linear Equations Using Matrices Summer 2014 when it is row reduced to either Row-Echelon form or Reduced Row-Echelon form. In other
Solving ODEs in Matlab - MIT
web.mit.eduIII. Solving systems of first-order ODEs! dy 1 dt =y 2 dy 2 dt =1000(1 "y 1 2) 2 1! y 1 (0)=0 y 2 (0)=1 van der Pol equations in relaxation oscillation: To simulate this system, create a function osc containing the equations. Method 1: preallocate space in a column vector, and fill with derivative functions function dydt = osc(t,y)
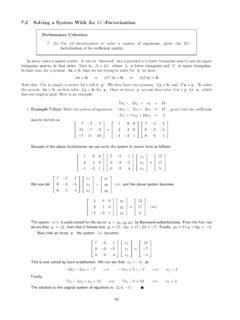
7.2 Solving a System WithAn LU-Factorization
math.oit.edu7.2 Solving a System WithAnLU-Factorization Performance Criterion: 7. (b) Use LU-factorization to solve a system of equations, given the LU-factorization of its coefficient matrix. In many cases a square matrix A can be “factored” into a product of a lower triangular matrix and an upper
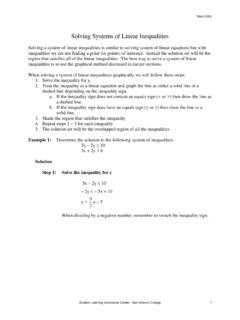
Solving Systems of Linear Inequalities - Alamo Colleges …
www.alamo.eduSolving a system of linear inequalities is similar to solving system of linear equations but with inequalities we are not finding a point (or points) of intersect. Instead the solution set will be the ... 2. Step 7: The solution set will be the overlapped region . The solution set region (as shown in green) would include the part of the solid ...
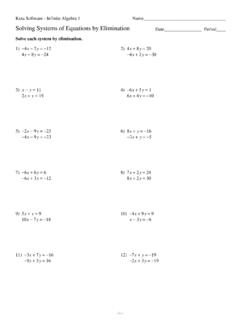
Systems of Equations Elimination
cdn.kutasoftware.comSolving Systems of Equations by Elimination Date_____ Period____ Solve each system by elimination. 1) −4 x − 2y = −12 4x + 8y = −24 (6, −6) 2) 4x + 8y = 20 −4x + 2y = −30 (7, −1) 3) x − y = 11 2x + y = 19 (10 , −1) 4) −6x + 5y = 1 6x + 4y = −10 (−1, −1) 5) −2x − 9y = −25 −4x − 9y = −23 (−1, 3) 6) 8x + y ...
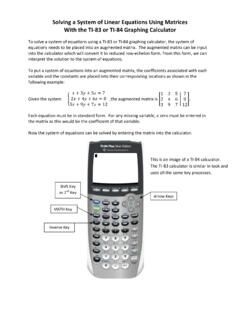
Solving a System of Linear Equations Using Matrices With …
pshs.psd202.orgthat x = -7/8. The second row shows that y = 3/4, and the third row shows that z = 9/8. When solving a system of equations with matrices, there are 3 possible results when reducing the matrix into Reduced Row Echelon Form. 1) Independent When a system is independent, there is exactly one solution to the system. The result will look like: [|
The PIECES Problem-Solving Framework and Checklist
www.csus.edu7. Decision - making errors are occurring B. Too much control or security 1. Bureaucratic red tape slows the system 2. Controls inconvenience customers or employees 3. Excessive controls cause processing delays EFFICIENCY Problems, Opportunities, and Directives A. People, machines, or computers waste time 1. Data is redundantly input or copied 2.