
Split Plots - UMN Statistics
A split split plot has three sizes of units: whole plots that are made up of split plots which are made up of split split plots. Two levels of nesting in the unit structure: split split plots nest into split plots, and split plots nest into whole plots. You need at least three factors: a whole plot treatment factor, a
Download Split Plots - UMN Statistics

Information
Domain:
Source:
Link to this page:
Documents from same domain

A First Course in Design and Analysis of Experiments
users.stat.umn.eduA First Course in Design and Analysis of Experiments Gary W. Oehlert University of Minnesota
Nathaniel E. Helwig - Statistics
users.stat.umn.eduMultivariate Linear Regression Nathaniel E. Helwig Assistant Professor of Psychology and Statistics University of Minnesota (Twin Cities) Updated 16-Jan-2017
Computing Primer for Applied Linear Regression, …
users.stat.umn.eduThis computer primer supplements Applied Linear Regression, 4th Edition (Weisberg,2014), abbrevi-ated alr thought this primer. The expectation is that you will read the book and then consult this primer to see how to apply what you have learned using R.

On the Markov Chain Central Limit Theorem - Statistics
users.stat.umn.eduOn the Markov Chain Central Limit Theorem Galin L. Jones School of Statistics University of Minnesota Minneapolis, MN, USA galin@stat.umn.edu Abstract The goal of this paper is to describe conditions which guarantee a central limit theorem for functionals of general state space Markov chains. This is done with a view towards Markov

Factor Analysis - University of Minnesota
users.stat.umn.eduFactor Analysis Model Model Form Factor Model with m Common Factors X = (X1;:::;Xp)0is a random vector with mean vector and covariance matrix . The Factor Analysis model assumes that X = + LF + where L = f‘jkgp m denotes the matrix offactor loadings jk is the loading of the j-th variable on the k-th common factor F = (F1;:::;Fm)0denotes the vector of latentfactor scores

Data, Covariance, and Correlation Matrix
users.stat.umn.eduThe Data Matrix R Code Row and Column Means > # get row means (3 ways) > rowMeans(X)[1:3] Mazda RX4 Mazda RX4 Wag Datsun 710 29.90727 29.98136 23.59818
The Adaptive Lasso and Its Oracle Properties
users.stat.umn.eduof Minnesota, Minneapolis, MN 55455 (E-mail: hzou@stat.umn.edu ). The au-thor thanks an associate editor and three referees for their helpful comments and suggestions. Sincere thanks also go to a co-editor for his encouragement. high variability and in addition is often trapped into a local op-timal solution rather than the global optimal solution.

Linear Mixed-Effects Regression - Statistics
users.stat.umn.eduNesting typically introduces correlation into data at level-1 Students are level-1 and schools are level-2 Dependence/correlation between students from same school We need to account for this dependence when we model the data. Nathaniel E. Helwig (U of Minnesota) Linear Mixed-Effects Regression Updated 04-Jan-2017 : Slide 8
Robust Regression - University of Minnesota
users.stat.umn.eduRobust Regression John Fox & Sanford Weisberg October 8, 2013 All estimation methods rely on assumptions for their validity. We say that an estimator or statistical procedure is robust if it provides useful information even if some of the assumptions used to justify the estimation method are not applicable. Most of this appendix concerns robust

Selecting the Number of Bins in a Histogram: A Decision ...
users.stat.umn.eduA Decision Theoretic Approach ... closely tied to our desire to exploit the Bayesian bootstrap to give a sensible solution for this problem. To see how it works in practice we considered eight difierent densities on the unit interval. The flrst was the Uniform
Related documents

The Analysis of Split-Plot Experiments
www2.compute.dtu.dkwhole plots. The reason is that in this experimental design we have randomized the levels of A on the whole plots so that an experimental unit corresponding to A is a whole plot. Based on the additive split-plot model given by (7-2) a test for an effect of the whole plot factor A, that is the hypothesis H0: a(a 1) = = a(a k), is equivalent to ...
A First Course in Design and Analysis of Experiments
users.stat.umn.eduA First Course in Design and Analysis of Experiments Gary W. Oehlert University of Minnesota

list of some useful R functions - Columbia University
www.columbia.edu{ rsq.rpart: plots the approximate r-square for the di erent splits ("rpart") { tile.tree: add class barplots to a classi cation tree plot ("tree") { tree.control: select parameters for tree (tree) { tree.screens: split screen for plotting trees ("tree") { tree: t a classi cation or regression tree ("tree") 7

THE MAXWELL-BOLTZMANN DISTRIBUTION FUNCTION
www.columbia.eduthe plots you can determine the most probable speed for a given molecular weight and ... The equation for the energy distribution has been split into three parts (i) a constant term called coeff in the spreadsheet, (ii) E term and (iii) the exponential term. dNE /N dE
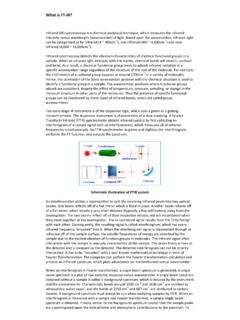
What is FT IR? - Northwestern University
www.nuance.northwestern.eduAn interferometer utilizes a beamsplitter to split the incoming infrared beam into two optical beams. One beam reflects off of a flat mirror which is fixed in place. ... present an infrared spectrum, which plots adsorbance (or transmittance) versus wavenumber. When an interferogram is Fourier transformed, a single beam spectrum is generated. ...

A Literary Approach to Teaching English Language in a ...
files.eric.ed.govtwo cultures—which to say the least, was an unfortunate split when they could have been helping one another. Both literature and language teaching involves the development of a feeling for language, of responses to “texts”—in the broadest sense of ... plots, themes, and the ideological assumptions of literature, thereby becoming active ...

The HPSPLIT Procedure - SAS
support.sas.comAt each step of the recursion, the parent node is split into child nodes through selection of a predictor variable and a split value that minimize the variability in the response across the child ... plots for cost-complexity analysis, and plots of ROC curves computes statistics for assessing model fit, including model-based (resubstitution ...

A TERNER CENTER REPORT - JULY 2021 Will Allowing …
ternercenter.berkeley.eduthe date of the approval of the urban lot split. Other • The parcel cannot have been created from a previous lot split as provided by this policy. • The same person (or another party acting on their behalf) cannot perform a lot split on adjacent lots. Table 1: Eligibility Criteria Proposed for Split Lots Under SB 9

HOW TO USE MINITAB - Worcester Polytechnic Institute
web.wpi.eduFRACTIONAL FACTORIAL DESIGNS Sometimes, there aren’t enough resources to run a Full Factorial Design. Instead, you can run a fraction of the total # of treatments. 2k-p kdesign = k factors, each with 2 levels, but run only 2-p treatments (as opposed to 2k) 24-1 design = 4 factors, but run only 23 = 8 treatments (instead of 16) 8/16 = 1/2 design known as a “½ replicate” or …

8 Flat Plate Analysis - Rice University
www.clear.rice.eduThen, the plots are pretty, but wrong. If the edges of the plate are simply sitting on top of to walls, then the wall could not pull down on the corner. ... reaction forces appear, then move the split line away from the corner and repeat the process. It may be a slow procedure, but it can lead you to the correct lift off regions. ...