
Stata: Visualizing Regression Models Using coefplot
region==MW 1.091 (0.148) region==S 1.324** (0.170) *** p<0.01, ** p<0.05, * p<0.1 4. Motivation ‐regression results are often presented in tables ‐however, displaying results graphically can be much more effective: easier to see and remember patterns and trends OUTCOME diabetes ...
Download Stata: Visualizing Regression Models Using coefplot

Information
Domain:
Source:
Link to this page:
Documents from same domain

Amelia multiple imputation in R - opr.princeton.edu
opr.princeton.eduAmelia I and II Amelia is an R package that has had two major revisions. It was originally developed by Gary King, James Honaker, Anne Joseph, and Kenneth Scheve in 2001:

Introduction to ggplot2 - Office of Population Research
opr.princeton.eduIntroduction to ggplot2 Dawn Koffman Office of Population Research Princeton University January 2014 . 2 Part 1: Concepts and Terminology . R Package: ggplot2 Used to produce statistical graphics, author = Hadley Wickham "attempt to take the good things about base and lattice graphics

Interpreting and Visualizing Regression models with Stata ...
opr.princeton.eduInterpreting regression models • Often regression results are presented in a table format, which makes it hard for interpreting effects of interactions, of categorical variables or effects in a non-linear models. • For nonlinear models, such as logistic regression, the raw coefficients are often not of much interest.
Related documents

2 MW Platform - GE.com
www.ge.comGE’s 2.0-2.5 MW, 116-meter rotor wind turbine offers 10,660 square meters in swept area, with an Annual Energy Production (AEP) of 11,832 MWh at 8.0 m/s (at a 2.5 rating, 90m HH). GE’s proprietary 56.9-meter blade is designed specifically for the 2.0-2.5 MW rating of this platform, enabling lower loads and improved performance.

INTREPID (175.5 MW) ADAMS (154.3 MW) CENTURY (201.2 …
www.midamericanenergy.comPOMEROY (296 MW) BEAVER CREEK II (175.7 MW) Pocahontas and Calhoun counties Greene County CHARLES CITY (80 MW) PRAIRIE (174.7 MW) Floyd County Mahaska County ADAIR (174.8 MW) NORTH ENGLISH (204.0 MW) Adair and Cass counties Poweshiek County WALNUT (165.2 MW) ARBOR HILL (310.4 MW) Pottawattamie County Adair County CARROLL (159.1 …

IEA Wind TCP Task - NREL
www.nrel.govDec 01, 1998 · 15-MW Turbine Parameter Units Value Power rating MW 15 Turbine class-IEC Class 1B Specific rating W/m 2 332 Rotor orientation-Upwind Number of blades-3 Control-Variable speed Collective pitch Cut-in wind speed m/s 3 Rated wind speed m/s 10.59 Cut-out wind speed m/s 25 Design tip-speed ratio-90 Minimum rotor speed rpm 5.0 Maximum rotor …

Title 12 - Utilities
cms.cityoftacoma.orgMar 29, 2019 · $0 - $9.99 . $0 ; $10.00 and over . 1% of balance with a $3.00 minimum : After the initial delinquency and failure to pay, the late payment fee shall compound on a monthly basis at the above-stated rate or 1 percent per month, whic hever is more. The fee will be assessed on the past due balance, and each utility will receive
MARYLAND FORM MW507
marylandtaxes.gov$150,000 $175,000 $0 $1,600 $175,000 $200,000 $0 $800 In excess of $200,000 $0 $0 FEDERAL PRIVACY ACT INFORMATION Social Security numbers must be included. The mandatory disclosure of your Social Security number is authorized by the provisions set forth in the Tax-General Article of the Annotated Code of Maryland. Such
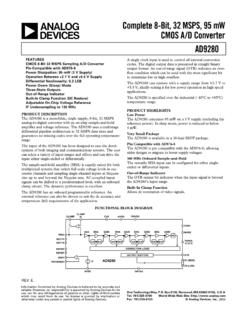
a Complete 8-Bit, 32 MSPS, 95 mW CMOS A/D Converter …
www.analog.comPower Dissipation: 95 mW (3 V Supply) Operation Between +2.7 V and +5.5 V Supply Differential Nonlinearity: 0.2 LSB Power-Down (Sleep) Mode Three-State Outputs Out-of-Range Indicator Built-In Clamp Function (DC Restore) Adjustable On-Chip Voltage Reference IF Undersampling to 135 MHz PRODUCT DESCRIPTION

Form MW-507: Employee’s Maryland Withholding …
www.usaid.govUpon receipt of any exemption certificate (Form MW 507), the Compliance Division will make a determination and notify you if a change is required. Once a certificate is revoked by the Comptroller, the employer must send any new certificate from the employee to the Comptroller for approval before implementing the new certificate.

DHI-ASI3213G-MW - Dahuasecurity.com
www.dahuasecurity.comJun 08, 2020 · www.dahuasecurity.com DHI-ASI3213G-MW Face Recognition Access Controller · 4.3 inch LCD touch screen; resolution 480×272 · With 2 MP wide-angle dual lens, white fill light, IR light · Support face, card and password unlock; unlock by period · User data can be stored at the access controller; can hold 1500 face images and work without network · Face-camera …