Stata: Visualizing Regression Models Using coefplot
‐regression results are often presented in tables ‐however, displaying results graphically can be much more effective: easier to see and remember patterns and trends OUTCOME diabetes SAMPLE Rural Non‐Rural female 1.185 0.993 (0.185) (0.121)
Download Stata: Visualizing Regression Models Using coefplot

Information
Domain:
Source:
Link to this page:
Documents from same domain

Amelia multiple imputation in R - opr.princeton.edu
opr.princeton.eduAmelia I and II Amelia is an R package that has had two major revisions. It was originally developed by Gary King, James Honaker, Anne Joseph, and Kenneth Scheve in 2001:

Introduction to ggplot2 - Office of Population Research
opr.princeton.eduIntroduction to ggplot2 Dawn Koffman Office of Population Research Princeton University January 2014 . 2 Part 1: Concepts and Terminology . R Package: ggplot2 Used to produce statistical graphics, author = Hadley Wickham "attempt to take the good things about base and lattice graphics
Interpreting and Visualizing Regression models with Stata ...
opr.princeton.eduInterpreting regression models • Often regression results are presented in a table format, which makes it hard for interpreting effects of interactions, of categorical variables or effects in a non-linear models. • For nonlinear models, such as logistic regression, the raw coefficients are often not of much interest.
Related documents
Lecture 3: Multiple Regression - Columbia University
www.columbia.eduU9611 Spring 2005 2 Outline Basics of Multiple Regression Dummy Variables Interactive terms Curvilinear models Review Strategies for Data Analysis Demonstrate the importance of inspecting, checking and verifying your data before accepting the results of

Bayesian Statistics (a very brief introduction)
faculty.washington.eduFor parameters in ‘1st year’ regression models, this idea works okay { it’s more generally known as ‘Objective Bayes’ For many other situations, it doesn’t, so use it carefully. (And also recall that prior elicitation is a useful exercise) 31
Using Logistic Regression: A Case Study
www.craftonhills.eduof the research: logistic regression, multicollinearity, dichotomous, etc. If appropriate, point out the difference in language when the results are described: relationship versus causation Mention that the full report that describes all of the methodology and limitations is available, but share the results in summary/visual form

Presentation of Regression Results Regression Tables
www.csus.eduECON 200A: Advanced Macroeconomic Theory Presentation of Regression Results Prof. Van Gaasbeck An example of what the regression table “should” look like. Note that it should be made clear in the text what the variables are and how each is measured. Table #1: Regression Results for Student 1991 Math Scores (standard deviations from the mean)

A Practical Guide to Regression Discontinuity - MDRC
www.mdrc.orgRegression discontinuity (RD) analysis is a rigorous nonexperimental1 approach that can be used to estimate program impacts in situations in which candidates are selected for treatment based on whether their value for a numeric rating exceeds a designated threshold or cut-point.
Using stargazer to report regression output and ...
www.princeton.eduUsing stargazer to report regression output and descriptive statistics in R (for non-LaTeX users) (v1.0 draft) ... This presentation will show some of the options stargazer offers, the contents are based on ... which allows a quick view of results •Output as html, which produce editable tables for Word documents. OTR 2 .
Title stata.com regress — Linear regression
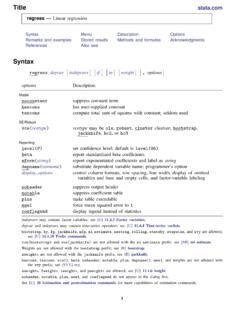
www.stata.comregress— Linear regression 5 SeeHamilton(2013, chap. 7) andCameron and Trivedi(2010, chap. 3) for an introduction to linear regression using Stata.Dohoo, Martin, and Stryhn(2012,2010) discuss linear regression using examples from epidemiology, and Stata datasets and do-files used in the text are available.Cameron