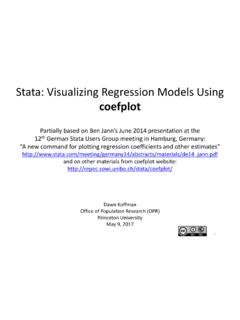
Stata: Visualizing Regression Models Using coefplot
‐regression results are often presented in tables ‐however, displaying results graphically can be much more effective: easier to see and remember patterns and trends female age bmi region==NE region==MW region==S.8 1 1.2 1.4 1.6 1.8 odds ratio: diabetes diabetes female 1.066 (0.102) age 1.059*** (0.004) ...
Download Stata: Visualizing Regression Models Using coefplot

Information
Domain:
Source:
Link to this page:
Documents from same domain

Amelia multiple imputation in R - opr.princeton.edu
opr.princeton.eduAmelia I and II Amelia is an R package that has had two major revisions. It was originally developed by Gary King, James Honaker, Anne Joseph, and Kenneth Scheve in 2001:

Introduction to ggplot2 - Office of Population Research
opr.princeton.eduIntroduction to ggplot2 Dawn Koffman Office of Population Research Princeton University January 2014 . 2 Part 1: Concepts and Terminology . R Package: ggplot2 Used to produce statistical graphics, author = Hadley Wickham "attempt to take the good things about base and lattice graphics
Interpreting and Visualizing Regression models with Stata ...
opr.princeton.eduInterpreting regression models • Often regression results are presented in a table format, which makes it hard for interpreting effects of interactions, of categorical variables or effects in a non-linear models. • For nonlinear models, such as logistic regression, the raw coefficients are often not of much interest.
Related documents
Logistic Regression - Pennsylvania State University
personal.psu.eduLogistic Regression Fitting Logistic Regression Models I Criteria: find parameters that maximize the conditional likelihood of G given X using the training data. I Denote p k(x i;θ) = Pr(G = k |X = x i;θ). I Given the first input x 1, the posterior probability of its class being g 1 is Pr(G = g 1 |X = x 1). I Since samples in the training data set are independent, the

Logs In Regression - Statistics Department
www-stat.wharton.upenn.eduThe fitted (or estimated) regression equation is Log(Value) = 3.03 – 0.2 Age The intercept is pretty easy to figure out. It gives the estimated value of the response (now on a log scale) when the age is zero. We would estimate the value of a “new” Accord (foolish using only data from used Accords) as Log(Value for Age=0) = 3.03
Lecture 5 Hypothesis Testing in Multiple Linear Regression
courses.washington.eduThe regression sums of squares due to X2 when X1 is already in the model is SSR(X2|X1) = SSR(X)−SSR(X1) with r degrees of freedom. This is also known as the extra sum of squares due to X2. SSR(X2|X1) is independent of MSE. We can test H 0: β2 = 0 with the statistic F 0 = SSR(X2|X1)/r MSE ∼ F r,n−p−1.

An Introduction to Logistic and Probit Regression Models
www.liberalarts.utexas.eduInterpretation • Logistic Regression • Log odds • Interpretation: Among BA earners, having a parent whose highest degree is a BA degree versus a 2-year degree or less increases the log odds by 0.477. • However, we can easily transform this into odds ratios by exponentiating the coefficients: exp(0.477)=1.61
(v. 6.3) - Princeton University
www.princeton.eduRegression: using dummy variables/selecting the reference category . If using categorical variables in your regression, you need to add n-1 dummy variables. Here ‘n’ is the number of categories in the variable. In the example below, variable ‘industry’ has twelve categories (type . tab industry, or. tab industry, nolabel)

Dummy-Variable Regression - SAGE Publications Inc
www.sagepub.comRegression O ne of the serious limitations of multiple-regression analysis, as presented in Chapters 5 and 6, is that it accommodates only quantitative response and explanatory variables. In this chapter and the next, I will explain how qualitative explanatory variables, called factors, can be incorporated into a linear model.1

Regression Analysis: A Complete Example - University of Idaho
www.webpages.uidaho.educ. Find the least squares regression line by choosing appropriate dependent and independent variables based on your answer in part a. d. Interpret the meaning of the values of a and b calculated in part c. e. Plot the scatter diagram and the regression line. f. Calculate rand 2 and explain what they mean. g.
Lecture 20 - Logistic Regression - Duke University
www2.stat.duke.eduLogistic Regression Logistic Regression Logistic regression is a GLM used to model a binary categorical variable using numerical and categorical predictors. We assume a binomial distribution produced the outcome variable and we therefore want to model p the probability of success for a given set of predictors.