
Stepwise Logistic Regression with R
Stepwise Logistic Regression with R ... = 2k + Deviance, where k = number of parameters Small numbers are better Penalizes models with lots of parameters Penalizes models with poor fit > fullmod = glm(low ~ age+lwt+racefac+smoke+ptl+ht+ui+ftv,family=binomial) ... > # Here was the chosen model from earlier > redmod1 = glm(low ~ lwt+racefac ...
Download Stepwise Logistic Regression with R

Information
Domain:
Source:
Link to this page:
Documents from same domain

SAS Example 4: Instrumental variables - University of Toronto
utstat.toronto.eduInstrumental variables on credit card data (Card1) 11 With house re-scaled (Express in tens of thousands) The CALIS Procedure Covariance Structure Analysis: Maximum Likelihood Estimation
Chapter 4 Introduction to Categorical Data Analysis Procedures
utstat.toronto.eduIntroduction to Multivariate Procedures, and PROC TRANSREG is summarized in Chapter 2, Introduction to Regression Procedures. A categorical variable is dened as …

Statistical Power Analysis for the Behavioral Sciences
utstat.toronto.eduform, by photostat, microform, retrieval system, or by any other means, without the prior written permission of the publisher. Library of Congress Cataloging-in-Publication Data Cohen, Jacob. Statistical power analysis for the behavioral sciences I Jacob Cohen. - 2nd ed. Bibliography: p. Includes index. ISBN 0-8058-0283-5 1.
Expected Value, Variance and Covariance
utstat.toronto.eduExpected ValueVarianceCovariance Conditional Expectation The idea Consider jointly distributed random variables Xand Y. For each possible value of X, there is a conditional distribution of Y. Each conditional distribution has an expected value (sub-population mean). If you could estimate E(YjX= x), it would be a good way to predict Y from X.

Multinomial Logit Models with R - University of Toronto
utstat.toronto.edu> # Estimate probabilities for a student with HSGPA = 90 > betahat1 Gone:(intercept) Passed:(intercept) Gone:hsgpa Passed:hsgpa 1.90422575 -13.39305637 -0.01881621 0.18643711
Stepwise Logistic Regression with R
utstat.toronto.eduNull deviance: 234.67 on 188 degrees of freedom Residual deviance: 234.67 on 188 degrees of freedom AIC: 236.67 Number of Fisher Scoring iterations: 4
Sampling from a Finite Population: Interval Estimation of ...
utstat.toronto.educlaim to have Internet access at home. (b) Give a 95% confidence interval for the true percentage of students who claim ... from stratum to stratum. For example, if you were interested in estimating the average hours of sports watched by students on a campus, it would be natural to stratify by sex. ...
Expected Value, Variance and Covariance - utstat.toronto.edu
utstat.toronto.eduExpected value is an average Imagine a very large jar full of balls. This is the population. The balls are numbered x 1;:::;x N. These are measurements carried out on members of the population. Suppose for now that all the numbers are di erent. A ball is selected at random; all balls are equally likely to be chosen. Let Xbe the number on the ...

Credit Scoring via Logistic RegressionI
utstat.toronto.eduLogistic regression is used in a wide variety of applications including biomedical studies, social science research, marketing as well as nancial applications. One example of the latter is the use of binary logistic regression models for credit-scoring, that is: modeling the probability that a …
Related documents
Lecture 10: Logistical Regression II— Multinomial Data
www.columbia.eduAbout Logistic Regression It uses a maximum likelihood estimation rather than the least squares estimation used in traditional multiple regression. The general form of the distribution is assumed. Starting values of the estimated parameters are used and the likelihood that the sample came from a population with those parameters is computed.
Logistic Regression - Pennsylvania State University
personal.psu.eduLogistic Regression Fitting Logistic Regression Models I Criteria: find parameters that maximize the conditional likelihood of G given X using the training data. I Denote p k(x i;θ) = Pr(G = k |X = x i;θ). I Given the first input x 1, the posterior probability of its class being g 1 is Pr(G = g 1 |X = x 1). I Since samples in the training data set are independent, the

Logistic Regression: Univariate and Multivariate
www.cantab.netFitting a Logistic Regression in R I We fit a logistic regression in R using the glm function: > output <- glm(sta ~ sex, data=icu1.dat, family=binomial) I This fits the regression equation logitP(sta = 1) = 0 + 1 sex. I data=icu1.dat tells glm the data are stored in the data frame icu1.dat. I family=binomial tells glm to fit a logistic model.
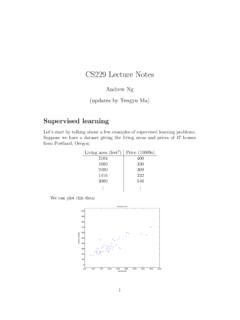
CS229LectureNotes - Stanford University
cs229.stanford.eduIf you’ve seen linear regression before, you may recognize this as the familiar least-squares cost function that gives rise to the ordinary least squares regression model. Whether or not you have seen it previously, let’s keep going, and we’ll eventually show this to be a special case of a much broader family of algorithms. 1 LMS algorithm
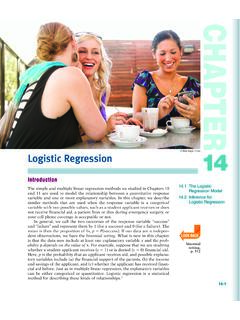
© Blend Images / Alamy 14 - Amherst College
nhorton.people.amherst.edu14.1 The Logistic Regression Model 14-5 Model for logistic regression In simple linear regression, we modeled the mean y of the response m variable y as a linear function of the explanatory variable: m 5 b 0 1 b 1 x. When y is just 1 or 0 (success or failure), the mean is the probability of p a success. Logistic regression models the mean p

The group lasso for logistic regression
people.ee.duke.eduGroup Lasso for Logistic Regression 55 Linear logistic regression models the conditional probability pβ.xi/=Pβ.Y =1|xi/ by log pβ.xi/ 1−pβ.xi/ =ηβ.xi/, .2:1/ with ηβ.xi/=β0 + G g=1 xT i,gβg, where β0 is the intercept and βg ∈Rdfg is the parameter vector corresponding to the gth predic- tor. We denote by β∈Rp+1 the whole parameter vector, i.e. β=.β0,βT