
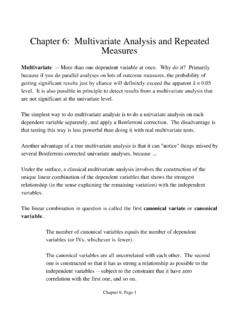
Table 1 Binomial distribution — probability function
Statistical Tables for Students Binomial Table 1 Binomial distribution — probability function p x 0.01 0.05 0.10 0.15 0.20 0.25 0.300.35 0.400.45 0.50
Download Table 1 Binomial distribution — probability function

Information
Domain:
Source:
Link to this page:
Documents from same domain

A Step by Step Guide to Learning SAS - University …
www.utstat.toronto.edu1 A Step by Step Guide to Learning SAS The Fundamentals of SAS Programming and an Introduction to Simple Linear Regression Models ... • 4.4 Some Basic Examples

Chapter 1 Introduction to Structural Equation Models
www.utstat.toronto.eduIntroduction to Structural Equation Models The design of this book is for Chapter0 to be a self-contained discussion of regression with measurement error, while this chapter introduces the classical structural equation models in their full generality. So, this chapter may serve as a …
Chapter 6: Multivariate Analysis and Repeated Measures
www.utstat.toronto.eduChapter 6: Multivariate Analysis and Repeated Measures ... Chapter 6, Page 3. E[Y|x] = ... risk -- the estimated probability that a patent will acquire an infection unrelated to what he or she caame in with. We will analyze these data as a two-way multivariate analysis of variance.

Principles of Statistical Inference - University of Toronto
www.utstat.toronto.eduPrinciples of Statistical Inference Reid & Cox, WSC2013 27 ... I Will statistical principles be helpful? I Are the classical principles enough? I “Inferential giants”: assessment of sampling bias, inference about tails, resampling inference, change point detection, reproducibility of analyses, causal inference for
Chapter 6 Likelihood Inference - Department of Statistical ...
www.utstat.toronto.eduThe likelihood function is one of the most basic concepts in statistical inference. Entire theories of inference have been constructed based on it. We discuss likeli-hood methods in Sections 6.1, 6.2, 6.3, and 6.5. In Section 6.4, we introduce some distribution-free methods of inference. These are not really examples of likelihood
University of Toronto
www.utstat.toronto.eduChapter 1 introduces the probability model and provides motivation for the study of probability. The basic properties of a probability measure are developed. Chapter 2 deals with discrete, continuous, joint distributions, and the effects of a change of variable. It also introduces the topic of simulating from a probability distribution.
![Downloaded by [University of Toronto] at 16:20 23 May 2014 ...](/cache/preview/9/0/c/3/5/7/1/e/thumb-90c3571e5c0834844e82dee36d59b967.jpg)
Downloaded by [University of Toronto] at 16:20 23 May 2014 ...
www.utstat.toronto.eduModeling and Analysis of Stochastic Systems. V.Kulkarni. Modelling Binary Data, Second Edition. D.Collett. Modelling Survival Data in Medical Research, Second Edition. D.Collett. Multivariate Analysis of Variance andRepeated Measures—A Practical Approach for Behavioural Scientists. D.J.Hand and C.C.Taylor. Multivariate Statistics—A ...
Repeated measures analysis with R
www.utstat.toronto.eduRepeated measures analysis with R Summary for experienced R users The lmer function from the lme4 package has a syntax like lm. Add something like + (1|subject) to the model for the random subject effect. To get p-values, use the car package. Avoid the lmerTest package. For balanced designs, Anova(dichotic, test="F") For unbalanced designs,

Statistical Power Analysis for the Behavioral Sciences
www.utstat.toronto.edutect operationally defined small, medi~m, and large effect sizes [a meta-analysis before the term was coined (Bangert-Drowns, 1986)]. I found rather poor power, for example, a mean of .48 at the two-tailed .05 level for medium effect sizes. Since the publication of the first edition (1969), there have been two or
Related documents

Binomial Distribution - University of Wisconsin–Madison
pages.stat.wisc.eduThe Binomial Distribution. The binomial distribution is applicable for counting the number of out-comes of a given type from a prespeci ed number n independent trials, each with two possible outcomes, and the same probability of the outcome of interest, p. The distribution is completely determined by n and p. The probability mass function is de ...

Negative Binomial Regression Models and Estimation …
www.icpsr.umich.edudistribution was developed to account for over-dispersion that is commonly observed in discrete or count data (Lord et al., 2005). It became very popular because the conjugate distribution (same family of functions) has a closed form and leads to the negative binomial distribution. As discussed by Cook
Notes on the Negative Binomial Distribution
www.johndcook.combinomial distribution that makes the connection with the Poisson more ex-plicit. Suppose Xj is a Poisson random variable and is a gamma( ; ) random variable. We create a new kind of random variable by starting with a Poisson but making it more variable by allowing the mean parameter to itself be random. P(X= x) = 1 ( ) Z 1 0

The geometric distribution - Math
www.math.utah.eduThe Poisson distribution 57 The negative binomial distribution The negative binomial distribution is a generalization of the geometric [and not the binomial, as the name might suggest]. Let us fix an integer) ≥ 1; then we toss a!-coin until the)th heads occur. Let X) denote the total number of tosses. Example 4 (The negative binomial ...

Worksheet: Binomial Distribution
www.npsd.k12.nj.usWorksheet: Binomial Distribution Multiple Choice Identify the letter of the choice that best completes the statement or answers the question. ____ 1. Which of the following is not a property of a Binomial Experiment? a. All trials are identical. b. Each trial has only two possible outcomes. c. The probability of success may change from trial to ...

Table 4 Binomial Probability Distribution
www.sjsu.eduTable 4 Binomial Probability Distribution Cn,r p q r n−r This table shows the probability of r successes in n independent trials, each with probability of success p ...
The Binomial Probability Distribution
www.stat.purdue.eduThe Binomial Random Variable and Distribution In most binomial experiments, it is the total number of S’s, rather than knowledge of exactly which trials yielded S’s, that is of interest. Definition The binomial random variable X associated with a binomial experiment consisting of n trials is defined as X = the number of S’s among the n trials
The Binomial Distribution
www3.nd.eduIn a binomial distribution the probabilities of interest are those of receiving a certain number of successes, r, in n independent trials each having only two possible outcomes and the same probability, p, of success. So, for example, using a binomial distribution, we can determine the probability of getting 4 heads in 10 coin tosses.