
The Normal Distribution - UCA
How to Use Table A.2: The values in this table represent the proportion of areas in the standard normal curve, which has a mean of O, a standard deviation of 1.00, and a total area equal to 1.00. The raw scores must first be transformed into a z score. Column A represents this z score, Column B represents the distance between the mean of the
Download The Normal Distribution - UCA

Information
Domain:
Source:
Link to this page:
Documents from same domain

PRIVATELY FUNDED 2018 - 2019 SCHOLARSHIPS
uca.eduPAGE | 3 HERBY BRANSCUM, JR. SCHOLARSHIP For full-time students from Arkansas with preference given to first-generation college students from Perry or Stone County.
University Scholarship Policy 2018 Transfer …
uca.edu1 University Scholarship Policy 2018 Transfer Scholarship Policy Amount $4,000/year (Fall/Spring) Eligibility: Required documentation must be received by the Office of Admissions and Enrollment Services by the
UNIVERSITY OF CENTRAL ARKANSAS BOARD …
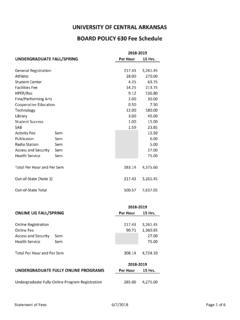
uca.eduUNIVERSITY OF CENTRAL ARKANSAS BOARD POLICY 630 Fee Schedule GRADUATE FALL/SPRING Per Hour 12 Hrs. General Registration 267.05 3,204.60 Athletic 18.00 216.00
Step 1. Defining the Population Step 2. …
uca.edu7 - 2 Introduction to Sampling The way in which we select a sample of individuals to be research participants is critical. How we select participants (random sampling) will determine the population to which we may generalize our research

2018-2019 Freshman Academic Scholarships
uca.edu2018-2019 Freshman Academic Scholarships Scholarship policies are subject to change. Please visit the Office of Student Financial Aid in Harrin Hall Suite 200 or online

University Scholarship Policy Scholarship …
uca.eduTranscript Exception – For First-Time Undergraduate/Transfer Students Only.An academic scholarship transcript exception may be requested for the receipt of a High School or Transfer transcript in the event there was a technical

Importance of Correlational Research Addressing ...
uca.edu15 - 2 Introduction to Nonexperimental Designs We have said much about true experiments and we have described their strength in …
ACTM – Statistics
uca.eduQuestions 1 – 25 are multiple-choice items. Record your answer on the answer sheet provided. When you have completed the multiple choice items, then answer each of the three tie-breaker items in order. Record your answer and your work on the tie-breaker pages provided as part of the test booklet. When you finish, detach the tie breaker …
UNIVERSITY OF CENTRAL ARKANSAS BOARD …
uca.eduUNIVERSITY OF CENTRAL ARKANSAS BOARD POLICY 630 Fee Schedule GRADUATE FALL/SPRING Per Hour 12 Hrs. General Registration 267.05 3,204.60 Athletic 18.00 216.00

Spring 2018 Transfer Scholarship - UCA
uca.eduSpring 2018 Transfer Scholarship Scholarship policies are subject to change. Please visit the Office of Student Financial Aid in Harrin Hall Suite 200 or online
Related documents

Table of Standard Normal Probabilities for Negative Z-scores
clas.sa.ucsb.eduTable of Standard Normal Probabilities for Negative Z-scores z 0.00 0.01 0.02 0.03 0.04 0.05 0.06 0.07 0.08 0.09 -3.4 0.0003 0.0003 0.0003 0.0003 0.0003 0.0003 0.0003 ...

How to Read Standard Normal Table - University of Toronto
individual.utoronto.cawith the standard normal table. It is not a required reading, but it might help you to acquire necessary skills when solving probability questions. Look at the standard normal distribution table (I use only the fragment of it below). What does the number 0.3238 represent? It represents the area under the standard normal z 0.00 0.01 0.020.030.04 ...

STU Z Table - University of Arizona
www.math.arizona.eduSTANDARD NORMAL DISTRIBUTION: Table Values Represent AREA to the LEFT of the Z score. Z .00 .01 .02 .03 .04 .05 .06 .07 .08 .09 0.0 .50000 .50399 .50798 .51197 .51595 ...
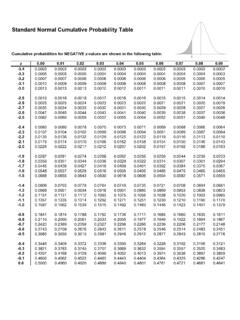
std normal table - University of Arizona
www.math.arizona.eduStandard Normal Cumulative Probability Table Cumulative probabilities for POSITIVE z-values are shown in the following table: Title: std normal table.xls Created Date:

Standard normal probabilities - Eastern Illinois University
ux1.eiu.eduT-2 • Tables Table entry for z is the area under the standard normal curve to the left of z. Probability z TABLE A Standard normal probabilities z.00 .01 .02 .03 ...

Table Z: Areas under the standard normal curve (negative Z)
people.richland.eduTable Z: Areas under the standard normal curve (negative Z) Second decimal place in z 0.09 0.08 0.07 0.06 0.05 0.04 0.03 0.02 0.01 0.00 z * 0.0000 -3.9

Standard Normal Distribution Table - Society of Actuaries
www.soa.orgSTANDARD NORMAL DISTRIBUTION TABLE . Entries represent Pr(Z. ≤ z). The value of . z. to the first decimal is given in the left column. The second decimal is given in the top row.

NORMAL DISTRIBUTION TABLE - Society of Actuaries
www.soa.orgNORMAL DISTRIBUTION TABLE Entries represent the area under the standardized normal distribution from f to z Z z, Pr( ) The value of z to the first decimal is given in the left column.

TABLE C.1 The Unit Normal Table - WebAssign
www.webassign.net•••Appendix C Statistical Tables TABLE C.1 The Unit Normal Table Column (A) lists z-score values.Column (B) lists the proportion of the area between the mean and the z-score value. Column (C) lists the proportion of the area beyond the z score in the tail of the distribution. (Note: Because the normal distribution is symmetrical, areas for negative z scores are the same as …