Example: quiz answers
TABLE C.1 The Unit Normal Table - WebAssign
•••Appendix C Statistical Tables TABLE C.1 The Unit Normal Table Column (A) lists z-score values.Column (B) lists the proportion of the area between the mean and the z-score value. Column (C) lists the proportion of the area beyond the z score in the tail of the distribution. (Note: Because the normal distribution is symmetrical, areas for negative z scores are the same as …
Tags:
Information
Domain:
Source:
Link to this page:
Documents from same domain
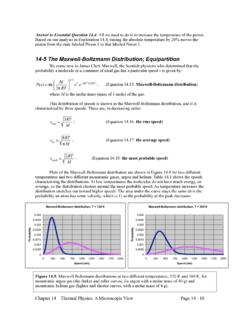
14-5 The Maxwell-Boltzmann Distribution; …
www.webassign.netTable 14.1: The various speeds characterizing the Maxwell-Boltzmann distribution of speeds for monatomic argon gas, and for monatomic helium gas, …

Hypothesis Testing: Single Mean and Single …
www.webassign.net370 CHAPTER 9. HYPOTHESIS TESTING: SINGLE MEAN AND SINGLE PROPORTION 1. Set up two contradictory hypotheses. 2. Collect sample data (in homework problems, the data or summary statistics will be given to you).

1-2 Unit Conversions, and Significant Figures
www.webassign.netWe treat conversion factors as having an infinite number of significant figures and we remember that the minimum number of significant figures in …
Student Quick Start Guide: WebAssign
www.webassign.net1 Student Quick Start Guide WebAssign This Quick Start Guide provides information to help you start using WebAssign. ENROLL WITH A CLASS KEY Your instructor might give you a class key like

Covalent and Ionic Compounds: Classi cation, Formu- las ...
www.webassign.netCovalent and Ionic Compounds: Classi cation, Formu-las, and Nomenclature ... both ionic and covalent. By the end of the lab you should be able to name the compounds you will encounter in general chemistry, as well as write the chemical formula if given a name. ... the bond can help predict whether the bond is likely to be ionic, covalent, or ...

Student Quick Start Guide: WebAssign in Canvas
www.webassign.net1 Student Quick Start Guide WebAssign in Canvas™ If enabled, you can access WebAssign from Canvas™ to complete coursework. ACCESS WEBASSIGN FROM CANVAS If enabled, you can open WebAssign from your Canvas

Chapter 13 { Organic Chemistry - WebAssign
www.webassign.netChapter 13 { Organic Chemistry Introduction Organic chemistry is the study of carbon based compounds. The structural and genetic materials of living organisms are organic compounds. Many of the substances that we encounter on a daily basis are organic compounds:

9-4 Solving Buoyancy Problems - WebAssign
www.webassign.net9-4 Solving Buoyancy Problems Archimedes was a Greek scientist who, legend has it, discovered the concept while taking ... Now, we include Archimedes’ principle. In general buoyancy problems are 1-dimensional, involving vertical forces, so that simplifies the method a little.

9-5 An Example Buoyancy Problem - WebAssign
www.webassign.net9-5 An Example Buoyancy Problem EXAMPLE 9.5 – Applying the general method Let’s now consider an object that sinks to the bottom of a beaker of liquid. The object is a ... Now, use Archimedes’ principle to transform the left-hand side of the equation:. Finally, write the …

3. Use of the calibration plot to determine the unknown ...
www.webassign.netSelected Thermodynamic Data A19 the graph. By this method, c 5 3.15 3 1024 mol/L, which agrees with the value obtained above. Recall that the original 0.1523-g steel sample was dissolved, the manganese
Related documents

How to Read Standard Normal Table - University of Toronto
individual.utoronto.cawith the standard normal table. It is not a required reading, but it might help you to acquire necessary skills when solving probability questions. Look at the standard normal distribution table (I use only the fragment of it below). What does the number 0.3238 represent? It represents the area under the standard normal z 0.00 0.01 0.020.030.04 ...
std normal table - University of Arizona
www.math.arizona.eduStandard Normal Cumulative Probability Table Cumulative probabilities for POSITIVE z-values are shown in the following table: Title: std normal table.xls Created Date:

Standard normal probabilities - Eastern Illinois University
ux1.eiu.eduT-2 • Tables Table entry for z is the area under the standard normal curve to the left of z. Probability z TABLE A Standard normal probabilities z.00 .01 .02 .03 ...

Standard Normal Distribution Table - Society of Actuaries
www.soa.orgSTANDARD NORMAL DISTRIBUTION TABLE . Entries represent Pr(Z. ≤ z). The value of . z. to the first decimal is given in the left column. The second decimal is given in the top row.

The Normal Distribution - UCA
uca.eduHow to Use Table A.2: The values in this table represent the proportion of areas in the standard normal curve, which has a mean of O, a standard deviation of 1.00, and a total area equal to 1.00. The raw scores must first be transformed into a z score. Column A represents this z score, Column B represents the distance between the mean of the

STU Z Table - University of Arizona
www.math.arizona.eduSTANDARD NORMAL DISTRIBUTION: Table Values Represent AREA to the LEFT of the Z score. Z .00 .01 .02 .03 .04 .05 .06 .07 .08 .09 0.0 .50000 .50399 .50798 .51197 .51595 ...

NORMAL DISTRIBUTION TABLE - Society of Actuaries
www.soa.orgNORMAL DISTRIBUTION TABLE Entries represent the area under the standardized normal distribution from f to z Z z, Pr( ) The value of z to the first decimal is given in the left column.

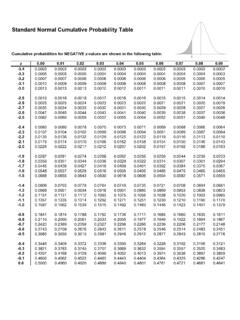
Table of Standard Normal Probabilities for Negative Z-scores
clas.sa.ucsb.eduTable of Standard Normal Probabilities for Negative Z-scores z 0.00 0.01 0.02 0.03 0.04 0.05 0.06 0.07 0.08 0.09 -3.4 0.0003 0.0003 0.0003 0.0003 0.0003 0.0003 0.0003 ...

Table Z: Areas under the standard normal curve (negative Z)
people.richland.eduTable Z: Areas under the standard normal curve (negative Z) Second decimal place in z 0.09 0.08 0.07 0.06 0.05 0.04 0.03 0.02 0.01 0.00 z * 0.0000 -3.9