
USING MATHCAD TO PLOT GRAPHS - FREE STUDY
USING MATHCAD TO PLOT GRAPHS Suppose you wish to plot v = 2 sin(ωt) You wish to plot v vertically against time t horizontally. STEP 1 Decide the starting and finishing values of time for the plot and the intervals at which you
Download USING MATHCAD TO PLOT GRAPHS - FREE STUDY

Information
Domain:
Source:
Link to this page:
Documents from same domain
UNIT 22: PROGRAMMABLE LOGIC CONTROLLERS …
www.freestudy.co.ukD.J.DUNN 1 UNIT 22: PROGRAMMABLE LOGIC CONTROLLERS Unit code: A/601/1625 QCF level: 4 Credit value: 15 TUTORIAL – OUTCOME 2 Part 2 This work covers part of outcome 2 of the Edexcel standard module.
UNIT 22: PROGRAMMABLE LOGIC CONTROLLERS …
www.freestudy.co.ukD.J.DUNN 2 1. INTRODUCTION Programming a PLC is helped by various aids such as LOGIC CIRCUITS, LADDER DIAGRAMS, TRUTH TABLES and …
INTRODUCTION TO BEAMS - FREE STUDY
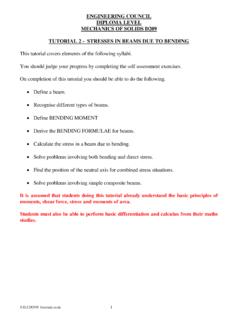
www.freestudy.co.uk© D.J.DUNN freestudy.co.uk 2 1 TYPES OF BEAMS A beam is a structure, which is loaded transversely (sideways). The loads may be …
EDEXCEL NATIONAL CERTIFICATE/DIPLOMA …
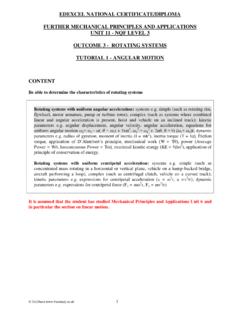
www.freestudy.co.uk© d.j.dunn www.freestudy.co.uk 1 edexcel national certificate/diploma further mechanical principles and applications unit 11 - nqf level 3 outcome 3 - rotating systems
EDEXCEL NATIONAL CERTIFICATE UNIT 10: …
www.freestudy.co.uk© d.j.dunn www.freestudy.co.uk 1 edexcel national certificate unit 10: properties and applications of engineering materials nqf level 3 outcome 1 - tutorial 1
INSTRUMENTATION AND CONTROL TUTORIAL 2 - …
www.freestudy.co.ukINSTRUMENTATION AND CONTROL TUTORIAL 2 – ELECTRIC ACTUATORS This is a stand alone tutorial on electric motors and actuators. The tutorial is of interest to
UNIT 61: ENGINEERING THERMODYNAMICS - FREE …
www.freestudy.co.uk© D.J.Dunn www.freestudy.co.uk 1 UNIT 61: ENGINEERING THERMODYNAMICS Unit code: D/601/1410 QCF level: 5 Credit value: 15 OUTCOME 4 STEAM AND GAS TURBINE POWER PLANT
Unit 24: Applications of Pneumatics and Hydraulics
www.freestudy.co.uk© D.J.DUNN 2 DIRECTIONAL VALVES 1. INTRODUCTION Valves are necessary to control the pressure, flow rate and direction of the fluid. Hydraulic valves are made
DYNAMICS TUTORIAL DAMPED VIBRATIONS Exam …
www.freestudy.co.ukSOLID MECHANICS DYNAMICS TUTORIAL – DAMPED VIBRATIONS This work covers elements of the syllabus for the Engineering Council Exam D225 – Dynamics of Mechanical Systems, C105 Mechanical and
SOLID MECHANICS DYNAMICS TUTORIAL …
www.freestudy.co.uk1.2 FREE VIBRATIONS- EXAMPLES A free vibration is one that occurs naturally with no energy being added to the vibrating system. The vibration is started by some input of energy but the vibrations die away with time as the energy
Related documents
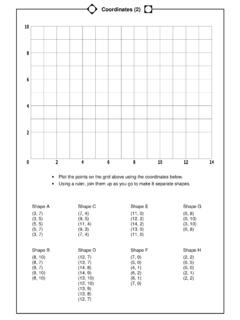
Coordinates (2) - Maths Worksheets
teachingimage.com• Plot the points on the grid above using the coordinates below. • Using a ruler, join them up as you go to make 8 separate shapes. Shape A Shape C Shape E Shape G
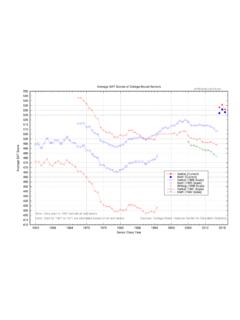
Average SAT Scores of College-Bound Seniors 550 545
www.erikthered.com410 415 420 425 430 435 440 445 450 455 460 465 470 475 480 485 490 495 500 505 510 515 520 525 530 535 540 545 550 1952 1958 1964 1970 1976 1982 1988 1994 2000 2006 ...
STANDING WAVE PLOTTING CHART At a minimum, plot …
www.firestik.comVehicle: Date: Antenna: Meter: 3.50 3.40 3.30 3.20 3.10 3.00 2.90 2.80 2.70 2.60 2.50 2.40 2.30 2.20 2.10 2.00 1.90 1.80 1.70 1.60 1.50 1.40 1.30 1.20 1.10 1.00 1 5 ...

Plot Summary oF - Manga, Shakespeare
www.mangashakespeare.comFind out more at: www.mangashakespeare.com www.mangashakespeare.ning.com Copyright SelfMadeHero 2008 Plot Summary oF The ghost of Prince Hamlet’s father appears to ...
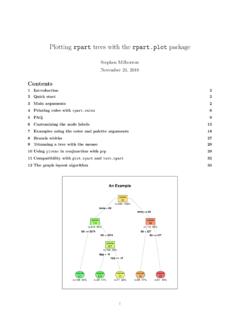
Plotting rpart treeswiththe rpart.plot package
www.milbo.org1 Introduction The functions in the rpart.plotR package plot rparttrees [6,7]. The next page shows some examples (Fig-ure 1). The workhorse function is prp.

ABSTRACT - South Central SAS® Users Group
www.scsug.org1 Multi-Panel Scatter Plots and Scatter Plot Matrices Paulina A. Kulesz,1, 2 David F. Francis,1, 2 Christopher D. Barr 2 1 Department of Psychology, University of Houston, Houston, TX, USA 2 Texas Institute for Measurement, Evaluation, and Statistics ABSTRACT A scatterplot is one of the most common tools utilized in the visual exploration of data.