
Visualizing Data using t-SNE - Journal of Machine Learning ...
almost infinitesimal (for reasonable values of the variance of the Gaussian, σi). Mathematically, the conditional probability pjji is given by pjji = exp k xi xjk2=2σ2 i ∑k6= i exp k xi xkk2=2σ2 i; (1) where σi is the variance of the Gaussian that is centered on datapoint xi. The method for determining the value of σi is presented later ...
Download Visualizing Data using t-SNE - Journal of Machine Learning ...
Information
Domain:
Source:
Link to this page:
Documents from same domain
A Tutorial on Conformal Prediction
jmlr.csail.mit.edutically independent. This allows us to interpret “being right 95% of the time” in an unusually direct way. In §2.1, we illustrate this point with a well-worn example, normally distributed random vari-ables. In §2.2, we contrast confidence with full-fledged …

Random Search for Hyper-Parameter Optimization
jmlr.csail.mit.eduRANDOM SEARCH FOR HYPER-PARAMETER OPTIMIZATION search is used to identify regions in Λthat are promising and to develop the intuition necessary to choose the sets L(k).A major drawback of manual search is the difficulty in reproducing results.
Mathematical Writing CS209. Mathematical Writing—
jmlr.csail.mit.eduMathematical Writing by Donald E. Knuth, Tracy Larrabee, and Paul M. Roberts This report is based on a course of the same name given at Stanford University during autumn quarter, 1987. Here’s the catalog description: CS209. Mathematical Writing—Issues of technical writing and the ef-fective presentation of mathematics and computer science.
An Introduction to Variable and Feature Selection
jmlr.csail.mit.eduoutside of the scope of machine learning, so we focus here on building predictors. We consider in this section ranking criteria defined for individual variables, independe ntly of the context of others. Correlation methods belong to that category. We also limit ourselves to supervised learning criteria.

Scikit-learn: Machine Learning in Python
jmlr.csail.mit.eduKeywords: Python, supervised learning, unsupervised learning, model selection 1. Introduction The Python programming language is establishing itself as one of the most popular languages for scientific computing. Thanks to its high-level interactive nature and its maturing ecosystem of sci-

A Neural Probabilistic Language Model - Journal of Machine ...
jmlr.csail.mit.eduobjects are almost maximally far from each other in hamming distance. A useful way to visualize how different learning algorithms generalize, inspired from the view of ... 1. n-grams withn up to 5 (i.e. 4 words of context) have been reported, though, but due to data scarcity, most predictions
Related documents

The Multivariate Gaussian Distribution - Stanford University
cs229.stanford.eduA vector-valued random variable X = X1 ··· Xn T is said to have a multivariate normal (or Gaussian) distribution with mean µ ∈ Rnn ++ 1 if its probability density function2 is given by p(x;µ,Σ) = 1 (2π)n/2|Σ|1/2 exp − 1 2 (x−µ)TΣ−1(x−µ) . of their basic properties. 1 Relationship to univariate Gaussians Recall that the ...
Gaussian Processes in Machine Learning
www.cs.ubc.caA Gaussian Process is a collection of random variables, any finite number of which have (consistent) joint Gaussian distributions. A Gaussian process is fully specified by its mean function m(x) and covariance function k(x,x0). This is a …

The Gaussian distribution - Washington University in St. Louis
www.cse.wustl.eduFigure 1: Examples of univariate Gaussian pdfs N(x; ;˙2). The Gaussian distribution Probably the most-important distribution in all of statistics is the Gaussian distribution, also called the normal distribution. The Gaussian distribution arises in many contexts and is widely used for modeling continuous random variables.
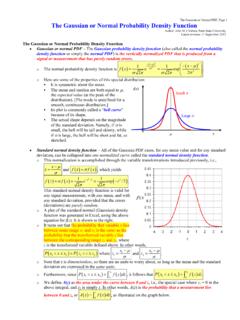
The Gaussian or Normal PDF, Page 1 The Gaussian or Normal ...
www.me.psu.edu(deviations) are purely random. o A plot of the standard normal (Gaussian) density function was generated in Excel, using the above equation for f(z). It is shown to the right. o It turns out that the probability that variable x lies between some range x 1 and x 2 is the same as the probability that the transformed variable z lies