WORKSHEET – Extra examples
2.1 Frequency Distributions and Their Graphs Example 1: The following data set lists the midterm scores received by 50 students in a chemistry class: 45 85 92 99 37 68 67 78 81 25 97 100 82 49 54 78 89 71 94 87 21 77 81 83 98 97 74 81 39 77
Download WORKSHEET – Extra examples

Information
Domain:
Source:
Link to this page:
Documents from same domain
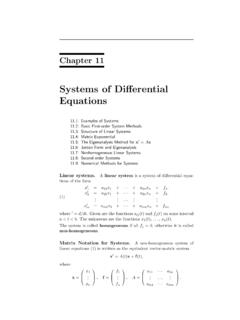
Systems of Differential Equations - Math
www.math.utah.edu522 Systems of Differential Equations Let x1(t), x2(t), x3(t) denote the amount of salt at time t in each tank. We suppose added to tank A water containing no salt. Therefore, the salt in all the tanks is eventually lost from the drains.
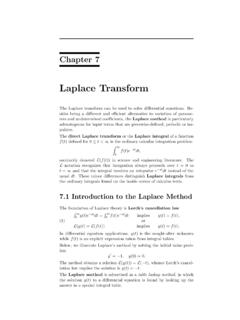
Laplace Transform - Home - Math
www.math.utah.eduLaplace Transform The Laplace transform can be used to solve di erential equations. Be-sides being a di erent and e cient alternative to variation of parame-ters and undetermined coe cients, the Laplace method is particularly advantageous for input terms that are piecewise-de ned, periodic or im-
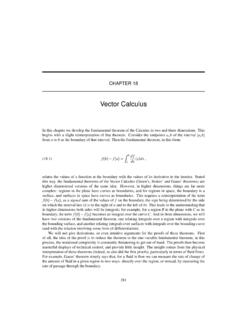
Vector Calculus - Math
www.math.utah.eduCHAPTER 18 Vector Calculus In this chapter we develop the fundamental theorem of the Calculus in two and three dimensions. This begins with a slight reinterpretation of that theorem.
Second Order Linear Differential Equations
www.math.utah.edu12.2 Behavior of the Solutions 179 Example 12.6 Find the solution y y x of y 2y 5y 0, with the initial values y 0 2 y 0 1. The auxiliary equation r2 2r 5 0 has the solutions r
Second Order Linear Differential Equations - Math
www.math.utah.eduSecond Order Linear Differential Equations 12.1. Homogeneous Equations A differential equation is a relation involvingvariables x y y y . A solution is a function f x such that the substitution y f x y f x y f x gives an identity. The differential equation is

Quadratic Equations By Factoring - Math
www.math.utah.eduSolving Quadratic Equations By Factoring Date_____ Period____ Solve each equation by factoring. 1) (3 n − 2)(4n ... If a quadratic equation cannot be factored then it will have at least one imaginary solution. False (Example, x2 = 10 )-2-Title: Quadratic Equations By Factoring

Magic Squares and Modular Arithmetic - Math
www.math.utah.eduIntroductory problems 1. Find a magic square of order three whose first row is 0 8 4 2. Find a magic square of order three whose first row is 1 8 3

Multivariable Mathematics with Maple
www.math.utah.eduMultivariable Mathematics with Maple Linear Algebra, Vector Calculus and Difierential Equations by James A. Carlson and Jennifer M. Johnson °c 1996 Prentice-Hall

LECTURE NOTES ON DONSKER’S THEOREM - Math
www.math.utah.eduLECTURE NOTES ON DONSKER’S THEOREM DAVARKHOSHNEVISAN ABSTRACT.Some course notes on Donsker’s theorem. These are for Math7880-1(“TopicsinProbability”),taughtattheDeparmentofMath-

9.3 Geometric Sequences and Series - math.utah.edu
www.math.utah.edu9.3 Geometric Sequences and Series In sections 9.3 you will learn to: • Recognize, write and find the nth terms of geometric sequences. ... • Use geometric sequences to model and solve real-life problems. A sequence a 1, a 2, a 3, ... ,a n is said to be geometric is the ratio between consecutive terms remains constant.
Related documents

Bernoulli Distribution
galton.uchicago.edu– Frequency function of X p(x) = ‰ µx(1¡µ)1¡x for x 2 f0;1g 0 otherwise – Often: X = ‰ 1 if event A has occured 0 otherwise Example: A = blood pressure above 140/90 mm HG. Distributions, Jan 30, 2003 - 1 -

Chapter 2: Frequency Distributions and Graphs (or making ...
math.ucdenver.eduCh2: Frequency Distributions and Graphs Santorico -Page 30 For quantitative variables we have grouped and ungrouped frequency distributions. An Ungrouped Frequency Distribution is a frequency distribution where each class is only one unit wide. Meaningful when the data does not take on many values.
Reading 7a: Joint Distributions, Independence
ocw.mit.eduJoint Distributions, Independence Class 7, 18.05 Jeremy Orlo and Jonathan Bloom 1 Learning Goals 1. Understand what is meant by a joint pmf, pdf and cdf of two random variables. 2. Be able to compute probabilities and marginals from a joint pmf or pdf. 3. Be able to test whether two random variables are independent. 2 Introduction
Chapter 5: Discrete Probability Distributions
coconino.eduChapter 5: Discrete Probability Distributions 158 This is a probability distribution since you have the x value and the probabilities that go with it, all of the probabilities are between zero and one, and the sum of all of the probabilities is one. You can give a probability distribution in table form (as in table #5.1.1) or as a graph.

RANDOM VARIABLES AND PROBABILITY DISTRIBUTIONS
www2.econ.iastate.edu4 RANDOM VARIABLES AND PROBABILITY DISTRIBUTIONS FX(x)= 0 forx <0 1 16 for0 ≤ x<1 5 16 for1 ≤ x<2 11 16 for2 ≤ x<3 15 16 for3 ≤ x<4 1 forx≥ 4 1.6.4. Second example of a cumulative distribution function. Consider a group of N individuals, M of
Chapter 2: Frequency Distributions - FTMS
ftms.edu.myFrequency Distributions •After collecting data, the first task for a researcher is to organize and simplify the data so that it is possible to get a general overview of the results. •This is the goal of descriptive statistical techniques. •One method for simplifying and organizing data is to construct a frequency distribution.

2.4.8 Kullback-Leibler Divergence
hanj.cs.illinois.edufrom an observed frequency distribution, as illustrate in the following example. Example 2.24. Computing the KL Divergence by Smoothing. Sup-pose there are two sample distributions P and Q as follows: P: (a: 3/5,b:
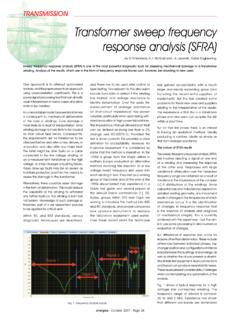
Transformer sweep frequency response analysis (SFRA)
www.ee.co.zafrequency range are obtained as a result of variations in the impedance of the complex L-C-R distributions of the windings. Since capacitances and inductances depend on detailed winding geometry, any movement results in changes in the frequencies at which resonances occur. It is the identification of changes in frequency response that

Random Variables, Distributions, and Expected Value
www0.gsb.columbia.eduRandom Variables, Distributions, and Expected Value Fall2001 ProfessorPaulGlasserman B6014: ManagerialStatistics 403UrisHall The Idea of a Random Variable