Transcription of Random Variables, Distributions, and Expected Value
1 Random Variables, Distributions, and Expected ValueFall 2001 Professor Paul GlassermanB6014: Managerial Statistics403 Uris HallThe Idea of a Random Variable1. Arandom variableis a variable that takes specific values with specific can be thought of as a variable whose Value depends on the outcome of an We usually denote Random variables by capital letters near the end of the alphabet; ,X,Y, Example: LetXbe the outcome of the roll of a die. ThenXis a Random variable . Itspossible values are 1, 2, 3, 4, 5, and 6; each of these possible values has probability 1 The word Random in the term Random variable doesnotnecessarily imply that theoutcome is completely Random in the sense that all values are equally likely.
2 Some valuesmay be more likely than others; Random simply means that the Value is When you think of a Random variable , immediately ask yourself What are the possible values? What are their probabilities?6. Example: LetYbe thesumof two dice rolls. Possible values:{2,3,4,..,12}. Their probabilities: 2 has probability 1/36, 3 has probability 2/36, 4 has probability3/36, etc. (The important point here is not the probabilities themselves, but ratherthe fact that such a probability can be assigned to each possible Value .)7. The probabilities assigned to the possible values of a Random variable are distribution completely describes a Random A Random variable is calleddiscreteif it has countably many possible values; otherwise,it is example, if the possible values are any of these: {1,2,3.}
3 ,} {.., 2, 1,0,1,2,..} {0,2,4,6,..} {0, , , , ,..} any finite setthen the Random variable is discrete. If the possible values are any of these: all numbers between 0 and all numbers between and all numbers between 0 and 1then the Random variable is continuous. Sometimes, we approximate a discrete randomvariable with a continuous one if the possible values are very close together; , stockprices are often treated as continuous Random The following quantities would typically be modeled as discrete Random variables: The number of defects in a batch of 20 items.
4 The number of people preferring one brand over another in a market research study. The credit rating of a debt issue at some date in the following would typically be modeled as continuous Random variables: The yield on a 10-year Treasury bond three years from today. The proportion of defects in a batch of 10,000 items. The time between breakdowns of a Distributions1. The rule that assigns specific probabilities to specific values for a discrete Random variableis called itsprobability mass a discrete Random variable thenwe denote its pmf byPX.
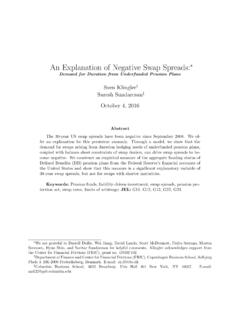
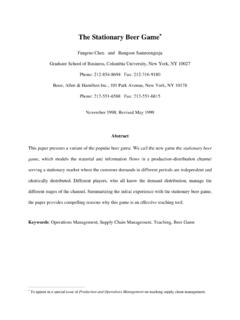
5 For any valuex,P(X=x) is the probability of the event thatX=x; ,P(X=x) = probability that the Value Example: IfXis the outcome of the roll of a die, thenP(X=1)=P(X=2)= =P(X=6)=1/6,andP(X=x) = 0 for all other values 3 2 1 1: Left panel shows the probability mass function for the sum of two dice; the possiblevalues are 2 through 12 and the heights of the bars give their probabilities. The bar heightssum to 1. Right panel shows a probability density for a continuous Random variable . TheprobabilityP(1<X ) is given by the shaded area under the curve betwee 1 and Thetotal area under the curve is 1.
6 The probability of any particular Value , ,P(X= 1) is zerobecause there is no area under a single NOTE: We always use capital letters for Random variables. Lower-case letters likexandystand for possible values ( , numbers) and are not A pmf is graphed by drawing a vertical line of heightP(X=x) at each possible is similar to a histogram, except that the height of the line (or bar) gives thetheoreticalprobabilityrather than theobserved Distributions1. The distribution of a continuous Random variable cannot be specified through a probabilitymass function because ifXis continuous, thenP(X=x) = 0 for allx; , the probabilityof any particular Value is zero.
7 Instead, we must look at probabilities ofrangesof The probabilities of ranges of values of a continuous Random variable are determined by adensityfunction. The density ofXis denoted byfX. The area under a density is always1. The probability thatXfalls between two pointsaandbis the area underfXbetweenthe pointsaandb. The familiar bell-shaped curve is an example of a Thecumulative distribution functionorcdfgives the probability that a randomvariableXtakes values less than or equal to a given valuex. Specifically, the cdf ofX,denoted byFX,isgivenbyFX(x)=P(X x).
8 So,FX(x) is the area under the densityfXto the left For a continuous Random variable ,P(X=x) = 0; consequently,P(X x)=P(X<x).For a discrete Random variable , the two probabilities are not in general The probability thatXfalls between two pointsaandbis given by the difference betweenthe cdf values at these points:P(a<X b)=FX(b) FX(a).SinceFX(b) is the area underfXto the left ofband sinceFX(a) is the area underfXtothe left ofa, their difference is the area underfXbetween the two of Random Variables1. Theexpected valueof a Random variable is denoted byE[X].
9 The Expected valuecan be thought of as the average Value attained by the Random variable ; in fact, theexpected Value of a Random variable is also called itsmean, in which case we use thenotation X.( is the Greek letter mu.)2. The formula for the Expected Value of a discrete Random variable is this:E[X]= all possiblexxP(X=x).In words, the Expected Value is the sum, over all possible valuesx,ofxtimes its probabilityP(X=x).3. Example: The Expected Value of the roll of a die is1(16)+2(16)+3(16)+ +6(16)=21/6= that the Expected Value is not one of the possible outcomes: you can t roll a , if you average the outcomes of a large number of rolls, the result We also define the Expected Value for a function of a Random variable .
10 Ifgis a function(for example,g(x)=x2), then the Expected Value ofg(X)isE[g(X)] = all possiblexg(x)P(X=x).For example,E[X2]= all possiblexx2P(X=x).In general,E[g(X)] is not the same asg(E[X]). In particular,E[X2] is not the same as(E[X]) The Expected Value of a continuous Random variable cannot be expressed as a sum; insteadit is an integral involving the density. (If you don t know what that means, don t worry;we won t be calculating any integrals.)46. Thevarianceof a Random variableXis denoted by eitherVar[X]or 2X.( is the Greekletter sigma.) The variance is defined by 2X=E[(X X)2];this is the Expected Value of the squared difference betweenXand its mean.