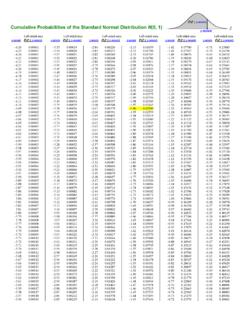
Transcription of Binomial Distribution - University of Wisconsin–Madison
1 R HelpProbability DistributionsFall 2003 Thisdocument willdescribe how to useR to calculateprobabilitiesassociatedwithcomm ondistribu-tionsas well as to graphprobability hasa number of builtin functionsforcalculationsinvolvingprobabi lity distributions, willseetheBinomial,Poisson, andNormaldistributionsearlyduringourintr oductionto probability. Later,we willusethet,F, andchi-squaredistributionsin each of thesedistributions(andothers),R functionhasa oneletterpre xfollowedby theroot nameof mnemonicsenseforcontinuousrandomvariable sbutareusedin examplednormis theheight of thedensity of a normalcurve whiledbinomreturnstheprobability of anoutcomeof a a xContinuousDiscreteddensityprobability (pmf)pprobability (cdf)probability (cdf)qquantilequantilerrandomrandomDistr ibutionRootBinomialbinomPoissonpoisNorma lnormttFFChi-squarechisqGraphingProbabil ity be usedto theiruse.
2 > source(" ")> gbinom(20, ) Distribution n = 20 , p = ValuesProbabilityThisplotwillhelpvisuali zetheprobability of gettingbetween45 and55 headsin 100cointosses.> gbinom(100, ,a = 45, b = 55, scale= T)BretLargetSeptember17, 2003R HelpProbability DistributionsFall Distribution n = 100 , p = ValuesProbabilityP(45 <= Y <= 55) = applicableforcountingthenumber of out-comesof a giventype froma prespeci ednumbernindependent trials,each withtwo possibleoutcomes,andthesameprobability of theoutcomeof interest,p. Thedistributionis completelydeterminedbynandp. Theprobability massfunctionis de nedas:PrfY=jg= nj pj(1 p)n jwhere nj =n!j!(n j)!is calleda binomialcoe cient.
3 (SometextbooksusethenotationnCjinstead.) In R, thefunctiondbinomreturnsthisprobability. Therearethreerequiredarguments:thevalue( s)forwhich tocomputetheprobability (j), thenumber of trials(n), andthesuccessprobability foreach trial(p).For example,herewe ndthecompletedistributionwhenn= 5 andp= 0:1.> dbinom(0:5,5, )[1] we want to ndthesingleprobability of exactly10 successesin 100trialswithp= 0:1, we dothis.> dbinom(10,100, )[1] , 2003R HelpProbability DistributionsFall 2003 Thefunctionpbinomis usefulforsummingconsecutive 5 andp= 0:1, 2g=pbinom(2,5, ):= 0:99144 PrfY 3g=1 PrfY 2g= 1 pbinom(2,5, ):= 0:00856 Prf1 Y 3g=PrfY 3g PrfY 0g= pbinom(3,5, ) pbinom(0,5, ):= 0:40905We canalso ndthequantilesof a example,hereis the90thpercentileofa binomialdistributionwithn= 200andp= 0:3.
4 Thefunctionqbinom 0:9 graphsthedistribution.> qbinom( ,200, )[1] 68> gbinom(200, ,scale= T, quantile= ) Distribution n = 200 , p = ValuesProbabilityThe quantile = 68 Thelastfunctionforthebinomialdistributio nis usedto take a randomsampleof 20 binomialrandomvariablesdrawnfromthebinom ialdistributionwithn= 10 andp= 0:5.> rbinom(20,10, )[1] 6 7 3 5 3 6 7 6 5 8 5 5 6 4 5 7 5 3 5 6 NormalDistributionNormaldistributionshav e symmetric,bell-shapeddensity curves thatarede-scribed by two parameters:themean andthestandarddeviation . Thetwo points of a normaldensitycurve thatarethesteepest|atthe\shoulders"of thecurve|arepreciselyonestandarddeviatio naboveandbelow , 2003R HelpProbability DistributionsFall 2003 Heights of individualcornplants may be modeledas normallydistributedwitha meanof 145cmandastandarddeviationof 22 cm(SamuelsandWitmer,thirdedition, ).
5 Youto plants:: : :largerthan100cm;> 1 - pnorm(100,145,22)[1] > gnorm(145,22, a = 100)Normal Distribution mu = 145 , sigma = 22 Possible ValuesProbability Density50100150200P( X < 100 ) = ( X > 100 ) = : : :between120cmand150cm:> pnorm(150,145,22) - pnorm(120,145,22)[1] > gnorm(145,22, a = 120,b = 150)BretLargetSeptember17, 2003R HelpProbability DistributionsFall 2003 Normal Distribution mu = 145 , sigma = 22 Possible ValuesProbability Density50100150200P( 120 < X < 150 ) = ( X < 120 ) = ( X > 150 ) = : : :150cmor less:> pnorm(150,145,22)[1] > gnorm(145,22, b = 150)Normal Distribution mu = 145 , sigma = 22 Possible ValuesProbability Density50100150200P( X < 150 ) = ( X > 150 ) = > qnorm( ,145,22)BretLargetSeptember17, 2003R HelpProbability DistributionsFall 2003[1] > gnorm(145,22, quantile= )Normal Distribution mu = 145 , sigma = 22 Possible ValuesProbability Density50100150200z = ( X < ) = of middle95%of thedistribution.
6 > ab = qnorm(c( , ),145,22)> ab[1] > gnorm(145,22, a = round(ab[1],1), b = round(ab[2],1))Normal Distribution mu = 145 , sigma = 22 Possible ValuesProbability Density50100150200P( < X < ) = ( X < ) = ( X > ) = , 2003R HelpProbability DistributionsFall 2003 OtherDistributionsOtherdistributionswork in a similarway, exceptthatI have notyet to expresstheparametersfordi erent probability distributionscanbe foundfromthehelp example,to learnabout ndPoissonprobabilities,type? , 2003