Example: confidence
Lecture 10 Sinusoidal steady-state and frequency response
Frequency (rad/sec) Phase (deg); Magnitude (dB) Bode Diagrams −60 −50 −40 −30 −20 −10 0 0.001 0.01 0.1 1 10 100 1000 −180 −160 −140 −120 −100 magnitudesameasstablepole;phasestartsat¡180–,increases Sinusoidal steady-state and frequency response 10{27
Tags:
Information
Domain:
Source:
Link to this page:
Documents from same domain
CHAPTER Logistic Regression - Stanford University
www.web.stanford.edulogistic the link between features or cues and some particular outcome: logistic regression. regression ... be viewed as a series of logistic regression classifiers stacked on top of each other. ... expresses how to generate the features of a document if we knew it was of class c.
Information Mapping - Stanford University
www.web.stanford.eduInformation mapping is a methodology specifically designed to make technical communication in business and industry easier and quicker. It is currently emerging from
CHAPTER N-gram Language Models
www.web.stanford.edu2 CHAPTER 3•N-GRAM LANGUAGE MODELS A probabilistic model of word sequences could suggest that briefed reporters on is a more probable English phrase than briefed to reporters (which has an awkward to after briefed) or introduced …
The Egg and the Sperm: How Science Has Constructed a ...
www.web.stanford.edusets up between male and female: the male, who continuously produces fresh germ cells, and the female, who has stockpiled germ cells by birth and is faced with their degeneration. Nor are the female organs spared such vivid descriptions. One scientist writes in a newspaper article that a woman's ovaries
Economics of Energy - Stanford University
www.web.stanford.edu48 Economics of Energy Energy economics is the field that studies human utilization of energy resources and energy commodities and the consequences of that utilization. In physical science terminology, “energy” is the capacity for doing work, e.g., lifting, accelerating, or heating material. In
CHAPTER Regular Expressions, Text Normalization, Edit Distance
www.web.stanford.eduELIZA The dialogue above is from ELIZA, an early natural language processing system that could carry on a limited conversation with a user by imitating the responses of a Rogerian psychotherapist (Weizenbaum,1966). ELIZA is a surprisingly simple program that uses pattern matching to recognize phrases like “I need X” and translate
CHAPTER Logistic Regression - Stanford University
www.web.stanford.edulearning. Machine learning classifiers require a training corpus of m input/output pairs (x(i);y(i)). (We’ll use superscripts in parentheses to refer to individual instances in the training set—for sentiment classification each instance might be an individual document to be classified.) A machine learning system for classification then ...
Paul Romer:Ideas,Nonrivalry,and Endogenous Growth
www.web.stanford.edu860 Paul Romer: ideas, nonrivalry, and endogenous growth as the most important paper in the growth literature since Solow’s Nobel-recognized work. In this article, I review Romer’s prize-winning work, putting it into the context of the surrounding literature and providing a retrospective on how this research has led to the modern ...
Acids and Bases Edit - Stanford University
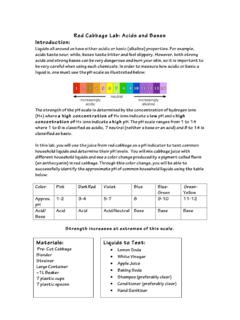
www.web.stanford.edu6. For baking soda, add 3 tablespoons of baking soda into 100 ml water. Example: 7. Pour 50 ml of cabbage juice into each of the cups. Do this one at a time and record the color change below: Liquid: Color Change/ pH Actual pH Hand Sanitizer Lemon Soda Apple Juice White Vinegar Baking Soda Shampoo Conditioner

An Introduction to Design Thinking PROCESS GUIDE
www.web.stanford.eduMentally it represents a process of Ògoing wideÓ in terms of concepts and outcomes. Ideation provides both the fuel and also the source material for building prototypes and getting innovative solutions into the hands of your users. WHY ideate You ideate in order to transition from identifying problems to creating solutions for your users.
Related documents

Chapter 17: Fundamentals of Time and Frequency
tf.nist.govfor frequency measurements is usually at a frequency of 1 MHz or higher, with 5 or 10 MHz being common. Frequency signals are usually sine waves, but can also be pulses or square waves. If the frequency signal is an oscillating sine wave, it might look like the one shown in Fig. 17.1. This signal produces one cycle (360 ∞ or 2 π
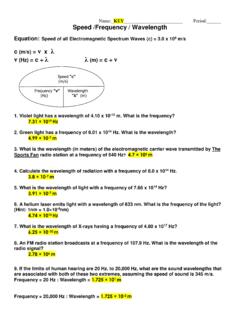
Name: KEY Period: Speed /Frequency / Wavelength
www.oakparkusd.orgWhat is the frequency? 7.31 × 10¹⁹ Hz 2. Green light has a frequency of 6.01 x 10¹⁴ Hz. What is the wavelength? 4.99 × 10⁻⁷ m 3. What is the wavelength (in meters) of the electromagnetic carrier wave transmitted by The Sports Fan radio station at a frequency of 640 Hz? 4.7 × 10⁵ m 4. Calculate the wavelength of radiation with a frequency of ...

Frequency and Phase Modulation - California State …
www.csun.eduis the frequency deviation constant in rad/volt – A constant envelope signal with varying frequency/phase – The instantaneous phase is: – The instantaneous frequency is: x PM (t)=A c cos[2πf c t+k p x(t)] θ i (t)=2πf c t+k p x(t) f i (t)= f c+ k p 2π dx(t) dt 10/14/08 17

FCC ONLINE TABLE OF FREQUENCY ALLOCATIONS
transition.fcc.govFrequency Allocations may display amendments that have been adopted by the FCC but that have not yet taken effect. NOTE: If a Rule Part is listed in the last column of the Allocation Table, click here to find those . Rules . Contact Tom Mooring at 202-418-2450 if you have any questions or comments. 1.

FM- Frequency Modulation PM - Phase Modulation
www.montana.edu1 1 FM- Frequency Modulation PM - Phase Modulation EELE445-14 Lecture 30 DSB-SC, AM, FM and PM [] = ∫−∞ = ± = + = t f p jD m d c jD m t c c c c g t A e g t A e g t A m t jm t

Frequency Adverbs - EnglishForEveryone.org
englishforeveryone.org1. Adverbs of frequency tell how often something happens. 2. Adverbs of frequency come before the main verb if the main verb is not “to be.” Examples: We usually eat breakfast at 7:00 a.m. Our dad never gets off work before 6:00. I sometimes wear a tie to work. 3. Adverbs of frequency come after the verb “to be.” (am, is, are, was, were)