Transcription of Tutorial Name Two-source interference - UMD …
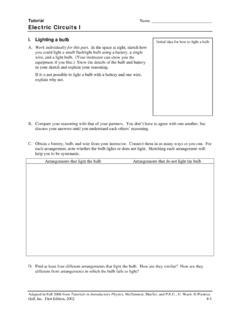
1 Tutorial name Two-source interference Adapted from tutorials in introductory physics , McDermott, Shaffer, and the physics Education Group at the University of Washington (Prentice-Hall, 1998) by the UMd PERG 1 I. Periodic circular waves: single source In a ripple tank, circular wavefronts are generated by beads tapping on water. The circles at right represent wavefronts of a periodic (that is, regularly repeating) circular wave in a portion of a ripple tank. The dark circles represent crests; the dashed circles, troughs. The diagram shows the locations of the wavefronts at one instant in time, as a photograph would.
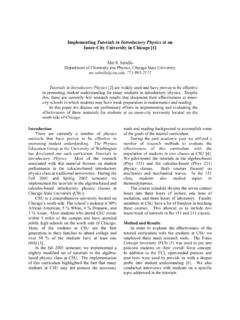
2 How, if at all, would the diagram differ: one-quarter period later? Explain. one period later? Explain. II. Periodic circular waves: two sources A. The diagram at right illustrates the wavefronts due to each of two small sources. 1. How do the frequencies of the two sources compare? (That is, do the two beads tap at the same rate?) Explain how you can tell from the diagram. 2. Are the two sources in phase or out of phase with respect to each other? (That is, do the beads tap together or do they alternate?) Explain how you can tell from the diagram. 3. What is the source separation? Express your answer in terms of the wavelength. Tutorial : Two-source interference Adapted from tutorials in introductory physics , McDermott, Shaffer, and the physics Education Group at the University of Washington (Prentice-Hall, 1998) by the UMd PERG.
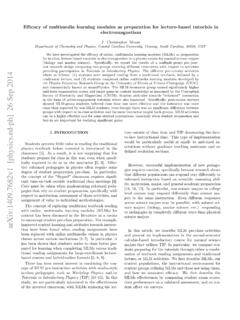
3 2 B. Describe what happens at a point on the surface of the water where: a crest meets a crest a trough meets a trough a crest meets a trough For each of the above cases, describe how your answer would differ if the amplitudes of the two waves were not equal. Explain your reasoning. If the waves from two identical sources travel different distances to reach a particular point, the amplitudes of the waves from the two sources will not be the same at that point. For points that are sufficiently far from the sources, however, this difference in the amplitudes of the waves is small. For the remainder of this Tutorial , we will ignore any such variations in amplitude. C. You have been provided a larger version of the diagram of the wavefronts due to two sources.
4 1. Use different colors to mark the places at which for the instant shown: the displacement of the water surface is zero ( , at its equilibrium level) the displacement of the water surface is the greatest above equilibrium the displacement of the water surface is the greatest below equilibrium (Hint: Look for patterns that will help you identify these points.) 2. What patterns do you notice? Sketch the patterns on the diagram in part A. D. The representation that we have been using indicates the shape of the water surface at one particular instant in time. 1. Consider a point on your diagram where a crest meets a crest. How would the displacement of the water surface at this point change over time? ( , What would the displacement be one-quarter period later?)
5 What would it be one-half period later?) 2. Consider what happens at a point on your diagram where a crest meets a trough. How will the displacement of the water surface at this point change over time? E. Suppose that a small piece of paper were floating on the surface of the water. On the basis of your diagram, predict where the paper would move (1) the least, and (2) the most. Tutorial : Two-source interference Adapted from tutorials in introductory physics , McDermott, Shaffer, and the physics Education Group at the University of Washington (Prentice-Hall, 1998) by the UMd PERG. 3 F. Consider a point where the water surface remains undisturbed. Mark one such point with an x on your diagram. 1. Explain why that point is not and cannot be the same distance from the two sources.
6 2. For the two sources that we are considering, by how much must the distances from that point to the two sources differ? Is there more than one possible value for the difference in distances? If so, list the other possible value(s) for the difference in distances. Explain. G. Choose a variety of points where the water surface remains undisturbed. 1. For each of these points, determine the difference in distances from the point to the two sources. We will call this difference in distances D. (This difference in distances is often called the path length difference.) 2. Divide all of the points where the water surface remains undisturbed into groups that have the same value of D. Label each group with the appropriate value of D, in terms of the wavelength.
7 3. Justify the term nodal lines for groups of points where the water remains undisturbed. (Hint: What s a node?) H. Similarly, group the points where there is maximum constructive interference according to their value of D. We will call these lines of maximum constructive interference . 1. Label each group with the appropriate value of D, in terms of the wavelength, . 2. Label each of the nodal lines and lines of maximum constructive interference with the corresponding value of , the phase difference between the waves from the two sources. (The phase difference is zero for waves that are in phase, and 180 for waves that are exactly out of phase.) I. Imagine observing the waves from above the ripple tank.
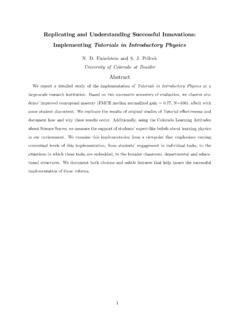
8 How, if at all, would the nodal lines and lines of maximum constructive interference change over time? Explain. Tutorial : Two-source interference Adapted from tutorials in introductory physics , McDermott, Shaffer, and the physics Education Group at the University of Washington (Prentice-Hall, 1998) by the UMd PERG. 4 J. Each of the photographs at right shows apart of a ripple tank that contains two sources that are in phase. 1. For each of the photographs, identify: nodal lines the approximate locations of the sources the line that contains the two sources 2. Which of the two photographs more closely corresponds to the situation that you have been studying? Explain your reasoning. 3. What difference(s) in the two situations could account for the difference in number and locations of the nodal lines?
9 (Hint: There are at least two.) K. Obtain a piece of paper and a transparency with concentric circles on them. The circles represent wavefronts generated by each of two point sources. 1. Suppose that the two sources are in phase and at the same location. Overlay the transparency on the paper to model this situation. Explain why there are no nodal lines in this case. 2. Gradually increase the source separation until you first see nodal lines. Sketch the nodal lines and the lines of maximum constructive interference for this situation. What is the source separation when this occurs? 3. Why can there be no nodal lines for a smaller source separation? Explain. (Hint: For a given source separation, what is the largest possible value of D?)
10 4. Continue to increase the source separation and investigate how the source separation affects the number of nodal lines and their locations. Tutorial : Two-source interference Adapted from tutorials in introductory physics , McDermott, Shaffer, and the physics Education Group at the University of Washington (Prentice-Hall, 1998) by the UMd PERG. 5 Discuss with a TA before you go.