Transcription of Blends: Pbleshoot system opera- proper low- and …
1 26 RSES Journal~ March 2006 Pressure-temperature (PT)charts can be used to trou-bleshoot system opera -tion, specifically to checkproper low- and high-sidepressures, set superheatand subcooling temperatures, and toset pressure controls. The tempera-ture glide of a blend will determinehow the PT chart will look. Therefore, a quick review of tem-perature glide from last month s arti-cle is necessary: As a portion of a refrigerantblend works its way down the lengthof an evaporator tube, local fraction-ation of the liquid, asit boils, will cause theboiling temperatureto increase. The average evapo-rator temperature is the averagebetween the temperature where theblend begins boiling at the expan-sion device and where it stops boil-ing at the end of the evaporator.
2 The average of the temperatureglide is used to compare to a singlerefrigerant s boiling point for pur-poses of having the same coil tem-perature. Temperature glide in the con-denser occurs in the same way as inthe evaporator, but the process isreversed as the components con-dense at different rates from the inletto the outlet. Bubble point and dew pointAs shown in Figure 1, a single-com-ponent refrigerant will either evapo-rate or condense at a single tempera-ture called the boiling point. Duringevaporation, the liquid reaches apoint where bubbles start to formand the liquid boils to vapor at theboiling the last drop of liquid dis-appears, any additional heat inputcauses the vapor to superheat (rise intemperature above the boilingpoint).
3 During condensation, thevapor forms liquid drops and contin-ues to condense to liquid at the boil-ing point. When the last of the vapordisappears, any additional removalof heat causes the liquid to subcool(lower in temperature below theRefrigerantBlends: and SystemP-T ChartsThe final article in this series focuses on theuse of pressure-temperature (PT) charts andhow they differ for blends compared to single-component refrigerantsBY JIM LAVELLEF igure 1 Part 3 Single-component refrigerants boil at one temperature, and superheat orsubcool measurements are compared to that boiling point. Blends changetemperature while boiling or condensing, so the end points of the glidemust be known in order to calculate superheat or subcool temperature.)
4 TroubleshootingSingle componentBlendsSuperheatvaporSubcooledli quidSubcooledliquidSuperheatvaporGlideBo ilingBoiling point(Constant pressure)Bubblepoint(Liquid with a bubble in it)(Vapor with a dew drop in it)DewpointBubble point and dew point for blendsTemperatureTemperatureMarch2006 ~ RSES Journal 27boiling point).For blends, the process is exactlythe same: liquid evaporates to satu-rated vapor and then superheatsfrom that point, or vapor condensesto saturated liquid and then subcoolsfrom that point. The difference witha blend is that while it is boiling it isalso warming up from the effects ofthe temperature glide (and coolingduring condensation).
5 The glide is not considered a sen-sible heat change in the same waythat superheat and subcool aredefined. Rather, glide is a function ofthe local fractionation effect on theblend as it travels along the heatexchanger. For a given pressure, the tempera-ture where a blend is saturated vaporwill be different from the tempera-ture where a blend is saturated liq-uid. A traditional PT chart would listthe pressure next to the boiling pointtemperature. For blends, there are two valuesfor the pressure/temperature rela-tionship one for the vapor and onefor the liquid. Since saturated liquidwill start to form bubbles when heat-ed, this is called the bubble , when saturated vaporstarts to cool it will form dewdrops,so it is called the dew point.
6 Troubleshooting with a PT chart There are several key troubleshoot-ing activities that require the use of aPT chart. It is important for the con-tractor or service tech to use the cor-rect data when performing theseactivities, such as determining theoperating coil temperature (or aver-age coil temperature). Service personnel will often wantto know at what temperature therefrigerant is boiling or condensinginside the coil. Popular refrigerants,such as R-22 and R-404A, will havethe temperature scale printed on thegauges and the coil temperature canbe read directly. The operating coil temperaturefor other single-component refriger-ants, or low-glide blends, can befound on the PT chart by finding thegauge s pressure reading and lookingFigure 2at the corresponding temperature(there will be only one column toread).
7 For higher-glide blends, how-ever, the task is a little more difficult(refer to Figure 2 above:) Type A chart:The pressure isfound on the left, and the average ofthe bubble point (liquid) and dewpoint (vapor) temperatures will givethe average coil temperature. Type B chart:In this case, youalso must know the temperatureglide for the blend you are using. Forthe evaporator, only the dew point(vapor) is given at colder tempera-tures. Since the dew point is the tem-perature of saturated vapor at theend of the evaporator, you will sub-tract one half of the temperatureglide to find the average temperatureat the middle of the the condenser, only the bub-ble point (liquid) is given at highertemperatures.
8 Since the bubble pointis the temperature of saturated liq-uid at the end of the condenser, youmust add one half of the glide to thebubble point to find the average coiltemperature. Type C chart:Pressures are list-ed in the columns and temperatureis on the left. The gauge pressuremust be found in each of the bubblepoint (liquid) and dew point (vapor)columns, then the correspondingtemperatures must be found foreach. The average of these two tem-peratures will be the average coiltemperature. Determining superheat and subcoolingThe process for determining super-heat or subcooling is exactly theIt is important to recognize which kind of PT chart you have beforeusing it to troubleshoot a system .
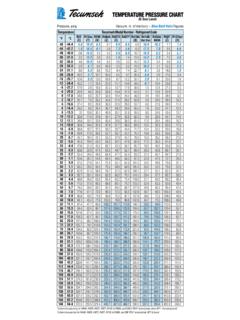
9 The figure shows the three basictypes of blend PT charts that are types of PT chartsPressure is on the left,andthe columns are blends, there are twocolumns for dew-point temper-ature and bubble-point tem-perature at each pressure.* Vapor** LiquidPressure (or temperature) is onthe left, and the columns con-tain temperatures (or pres-sures). For blends, lower tem-peratures list only dew-pointdata (for superheat measure-ments) and higher tempera-tures list only bubble-point data(for subcooling measurements).Temperature is on the left,columns contain pressures. Forblends,there are two columnsfor dew-point pressure andbubble-point pressure at AType BType CR-12R-12R-409AR-409AR-409AT FT FT F**forward for single-component refrig-erants and low-glide blends becausethere is only one pressure listed for agiven temperature.
10 For blends, how-ever, you must consider whether ornot the system is running at the a system is running use theaverage evaporator or condenser tem-perature to determine the correctpressure setting for the appropriatecontrol. For example, a cooling water-flowcontrol on a water-cooled condensermay be set to maintain a certain con-densing temperature. The correspon-ding pressure setting must be deter-mined by averaging the vapor andliquid data on the PT chart or addinghalf the glide for a type B chart. When a system is off the refriger-ant will sit somewhere in the systemas a liquid. From the fractionationdiscussion in part one of this series,you should remember that the vaporabove this liquid will adjust to a dif-ferent composition.