Transcription of Graphing Lines with a Table - Rock Creek Schools
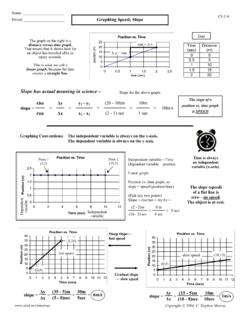
1 Graphing Lines with a Table Select (or use pre-selected) values for x Substitute those x values in the equation and solve for y Graph the x and y values as ordered pairs Connect points with a lineExample Graph y = 2x -1 Example Graph y = 2xExample Graph 2x + 3y = 4 Time to work Worksheet!Ch 7 Linear Slope The ratio of the rise, or vertical change, to the run, or horizontal changeriseslope = m = runExample Determine the slope of each Determine the slope of each of Change In real-life applications, slope is the rate of change (how much a value is changing)Example The graph below shows the distance traveled by Rebecca and Ian during a day-long bicycle ride.
2 Find the slope of each line . To what does the slope refer?Example A line contains the points whose coordinates are listed in the Table . Determine the slope of the Formula Example Determine the slope of each line . The line through the points at (3, 8) and (3, 4)Example Determine the slope of each line . The line through the points at (-4, 1) and (-3, -2)Example Determine the slope of each line . The line through the points at (2, 5) and (3, 9)Example Determine the slope of each line . The line through the points at (-8, 1) and (4, 1)Types of SlopeAssignments #1 due today P287: 1, 2, 4 12 even #2 due next time P288: 13 27, 34, 35, 36 Equations in Point-Slope FormPoint-Slope Form Replace the m, x1, and y1with the values givenExample Write the point-slope form of the equation of the line passing through the given point and having the given slope.
3 (-2, 7), m = -1/3 Example Write the point-slope form of the equation of the line passing through the given point and having the given slope.(4, 0), m = 4 Example Write the point-slope form of the equation of the line passing through the given point and having the given slope.(-3, 2), m = 2 Example Write the point-slope form of the equation of the line passing through the given point and having the given slope.(5, 4), m = -2/3 Writing from a graph You can also write an equation in point-slope form from a graph First find the slope of the line by counting Then pick a point (any point on the line will work) Plug those values into the formulaExample Write the point-slope form of an equation of the line Write the point-slope form of an equation of the line Write the point-slope form of an equation for the line passing through (1, 4) and (3, -5) Hints: find the slope first / it doesn t matter which point you #1 due today P293.
4 3 13 #2 due next time P293: 15 37 Equations in Slope-Intercept FormIntercepts y-intercept The point on the y-axis where the line crosses that axis x-intercept The point on the x-axis where the line crosses that axisSlope-Intercept Form Another form, besides point-slope This form helps you graph!y = mx + b m slope b y-intercept (point where it crosses y-axis)Example Write an equation in slope-int form of each line with the given slope and = 3, b = -1 Example Write an equation in slope-int form of each line with the given slope and = -2/3, b = 0 Example Write an equation in slope-int form of each line with the given slope and = 0, b = -4 Example Write an equation in slope-int form of each line with the given slope and = 2, b = 1 Example Write an equation in slope-int form of each line with the given slope and = -5/3.
5 B = 0 Example Write an equation in slope-int form of each line with the given slope and = 0, b = -8 Example Write an equation of the line in slope-intercept form for the situation:Slope 1 and passes through (2, 5)Example Write an equation of the line in slope-intercept form for the situation:Slope -3 and passes through (1, -4)Example Write an equation of the line in slope-intercept form for the situation:Passing through (-4, 4) and (2, 1)Example Write an equation of the line in slope-intercept form for the situation:Passing through (6, 2) and (3, -2)Example Write an equation of the line in slope-intercept form for the situation:Slope is and passes through (8, -2)Example Write an equation of the line in slope-intercept form for the situation:Passes through (2, 4) and (0, 5)Assignments #1 due today P299: 4 12 #2 due next time P299.
6 14 40 even, 41 45, 49 50, 53 57 PlotsScatter Plots Scatter Plot Graph where two sets of data are plotted as ordered pairs on the same coordinate plane Used to see if there is a trend, pattern, or relationship among the variablesScatter PlotsExample Determine whether the scatter plot shows a positive relationship, negative relationship, or no relationship. If there is a relationship, describe it. The scatter plot shows the number of years of experience and the salary for each employee in a small company. Example Determine whether the scatter plot shows a positive relationship, negative relationship, or no relationship.
7 If there is a relationship, describe it. The scatter plot shows the word processing speeds of 12 students and the number of weeks they have studied word processing. Example Determine whether the scatter plot shows a positive relationship, negative relationship, or no relationship. If there is a relationship, describe The Table shows the average number of minutes a pediatric dentist spends during each appointment instructing the patient in proper dental care, and the number of cavities for each Make a scatter plot of the data. Let the horizontal axis represent instruction time and let the vertical axis represent the number of cavities.
8 Does the scatter plot show a relationship between instruction time and cavities? Explain. Describe the independent and dependent variables. Then state the domain and the P305: 4 8, 10 17, 19 23 Linear EquationsGraphing with Intercepts What are intercepts? Point where the line crosses the x-and y-axes Find the intercepts and plot them, draw a line between Point of y-intercept is always (o, y) Point of x-intercept is always (x, 0)Example Determine the x-intercept and y-intercept of the graph of the line 2y x = 8. Then Determine the x-intercept and y-intercept of the graph of the line 3x 2y = 12.
9 Then Determine the x-intercept and y-intercept of the graph of the line x + y = 2. Then Determine the x-intercept and y-intercept of the graph of the line 3x + y = 3. Then Determine the x-intercept and y-intercept of the graph of the line 4x 5y = 20. Then Suppose to ship a package it costs $ for the first pound and $ for each additional pound. This can be represented by y = + Determine the slope and y-intercept of the graph of the Determine the slope and y-intercept of the graph 6x 9y = Determine the slope and y-intercept of the graph of 4x + 3y = Graph the equation using slope intercept Example Graph the equation using slope intercept Example Graph the equation using slope intercept Example Graph the equation using slope intercept Example Graph the equation using slope intercept Example Graph the equation using slope intercept Example Graph the
10 Equation using slope intercept Example Graph the equation using slope intercept Assignments P314: 7 11, 24 34 even, 36 38, 43 49 of Linear GraphsReview Slope formula: Point-Slope Form: Slope-Intercept Form:Linear GraphsExample Graph the pair of equations. Describe any similarities or differences. Explain why they are a family of Example Graph the pair of equations. Describe any similarities or differences. Explain why they are a family of Example Graph the pair of equations. Describe any similarities or differences.