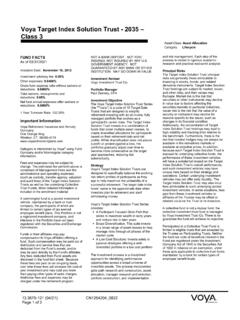
Transcription of Vanguard Total Stock Market Index - Voya Financial
1 As of 6/30/2020 Vanguard Total Stock Market IndexPerformance Disclosure: The performance data quoted represents past performance and does not guarantee future results. The investment return and principal value of an investment will fluctuate; thus an investor s shares, when redeemed, may be worthmore or less than their original cost. Current performance may be lower or higher than the return data quoted herein. For more current information including month-end performance, please call 1-888-401-5722 or visit AnalysisPortfolio Date: 6/30/2020% 10 HoldingsPortfolio Date: 6/30/2020% AssetsMicrosoft CorpApple IncFacebook Inc AAlphabet Inc AAlphabet Inc Class CJohnson & JohnsonBerkshire Hathaway Inc Class BVisa Inc Class AProcter & Gamble Number of Holdings3,532 Portfolio Date: 6/30/2020 Morningstar Equity Style Box Small Mid LargeValue Blend GrowthMarket Cap% Market Cap Giant % Cap Large % Cap Mid % Cap Small % Cap Micro % Equity SectorsPortfolio Date.
2 6/30/2020 Basic MaterialsConsumer CyclicalFinancial ServicesReal EstateCommunication ServicesEnergyIndustrialsTechnologyConsu mer Returns1 Year3 Years5 Years10 YearsSinceInceptionVanguard Total Stock Market IndexCRSP US Total Market TR USDUS OE Large 2019 2018 2017 2016 2015 20142013 2012 2011 2010 Vanguard Total Stock Market IndexCRSP US Total Market TR USDUS Fund Large : US DollarYTD201920182017201620152014 and ExpensesRedemption FeeNet Expense RatioGross Expense RatioGross Expense Ratio Per $1000 and ManagementInception DatePortfolio ManagerAdvisorTelephoneWeb SiteAnnual Turnover Ratio % Total Fund Assets ($mil)Issuer12/10/2012 Gerard C. O ReillyVanguard Group , RisksLoss of money, Not FDIC insured, Index Management, Market / Market Volatility, Equity Securities, Exchange Traded Funds5 Yr Risk MetricsStandard DeviationBetaInformation RatioUp Capture RatioDown Capture Objective & StrategyThe investment seeks to track the performance of a benchmark Index that measures the investment return of the overall Stock Market .
3 The fund employs an indexing investment approach designed to track the performance of the CRSP US Total Market Index , which represents approximately 100% of the investable Stock Market and includes large-, mid-, small-, and micro-cap stocks regularly traded on the New York Stock Exchange and Nasdaq. It invests by sampling the Index , meaning that it holds a broadly diversified collection of securities that, in the aggregate, approximates the full Index in terms of key investment's overall Morningstar Rating, based on its risk-adjusted return, is a weighted average of its applicable 3-, 5-, and 10-year Ratings. See disclosure for Morningstar RatingMorningstar CategoryCRSP US Total Market TR USD US Fund Large Blend 2020 Morningstar, Inc., Morningstar Direct TM 312-696-6000. All rights reserved. The information contained herein: (1) is proprietary to Morningstar and/or its content providers; (2) may not be copied or distributed and (3) is not warranted to be accurate, complete or timely.
4 Neither Morningstar nor its content providers are responsible for any damages or losses arising from any use of information. Past performance is no guarantee of future performance. Visit our investment website at of 6/30/2020 Vanguard Total Stock Market Index 2020 Morningstar, Inc., Morningstar Direct TM 312-696-6000. All rights reserved. The information contained herein: (1) is proprietary to Morningstar and/or its content providers; (2) may not be copied or distributed and (3) is not warranted to be accurate, complete or timely. Neither Morningstar nor its content providers are responsible for any damages or losses arising from any use of information. Past performance is no guarantee of future performance. Visit our investment website at Trading and/or Short Term TradingThis designated investment alternative may maintain a policy limiting excessive trading and/or short term trading. Frequent short-term trades within a mutual fund increase the administrative costs associated with processing transactions and in certain circumstances could dilute the returns earned by other fund shareholders.
5 Excessive trading policies provide for the monitoring of trading activity and will restrict a shareholder's trading privileges after a certain number of "round-trip" transactions. A "round trip" is typically defined as a purchase followed by a sale (or the opposite) within a specified period of DescriptionThe CRSP US Total Market Index , which represents approximately 100% of the investable Stock Market and includes large-, mid-, small-, and micro-cap stocks regularlytraded on the New York Stock Exchange and Gross/Net Expense Ratio is the operating cost and includes management fees and other expenses. The investment results listed are net of the Expense Rating Often simply called the Star Rating, the Morningstar Rating brings load-adjustments, performance (returns) and risk together into one evaluation. To determine a fund's star rating for a given time period (three, five, or 10 years), the fund's risk-adjusted return is plotted on a bell curve: If the fund scores in the top 10% of the category, it receives 5 stars (Highest); if it falls in the next it receives 4 stars (Above Average); a place in the middle 35% earns 3 stars (Average); those lower still, in the next , receive 2 stars (Below Average); and the bottom 10% get only 1 star (Lowest).
6 The Overall Morningstar Rating is a weighted average of the available three-, five-, and 10-year & Return StatisticsStandard Deviationis the statistical measurement of dispersion about an average, which depicts how widely a Stock or portfolio s returns varied over a certain period of time. Investors use the standard deviation of historical performance to try to predict the range of returns that is most likely for a given investment. When a Stock or portfolio has a high standard deviation, the predicted range of performance is wide, implying greater volatility. Morningstar computes standard deviation using the trailing monthly Total returns for the appropriate time period. All of the monthly standard deviations are then a measure of a fund s sensitivity to Market movements. The beta of the Market is by definition. Morningstar calculates beta by comparing a fund s excess return over Treasury bills to the Market 's excess return over Treasury bills, so a beta of shows that the fund has performed 10% better than its benchmark Index in up markets and 10% worse in down markets, assuming all other factors remain constant.
7 Conversely, a beta of indicates that the fund s excess return is expected to perform 15% worse than the Market s excess return during up markets and 15% better during down Ratiois a risk-adjusted performance measure. The information ratio is a special version of the Sharpe Ratio in that the benchmark doesn't have to be the risk-free Capture Ratiomeasures a manager's performance in up markets relative to the Market (benchmark) itself. It is calculated by taking the security s upside capture return and dividing it by the benchmark s upside capture Capture Ratiomeasures manager's performance in down markets. A down- Market is defined as those periods (months or quarters) in which Market return is less than 0. In essence, it tells you what percentage of the down- Market was captured by the manager. For example, if the ratio is 110%, the manager has captured 110% of the down- Market and therefore underperformed the Market on the Investment Profile may be preceded or accompanied by the fund's current prospectus or summary prospectus as well as this disclosure statement.
8 The performance data given represents past performance and should not be considered indicative of future results. Principal value and investment return will fluctuate, so that an investor's shares when redeemed may be worth more or less than the original investment. Fund portfolio statistics change over time. The fund is not FDIC-insured, may lose value and is not guaranteed by a bank or other Financial return reflects performance without adjusting for sales charges or the effects of taxation, but is adjusted to reflect all actual ongoing fund expenses and assumes reinvestment of dividends and capital gains. If adjusted, sales charges would reduce the performance Total Return is Total return adjusted for sales Return is based on net asset value for a fund. Net asset value is calculated by dividing the Total net assets of the fund by the Total number of shares. NAVs come directly from the fund company. ETF investors purchase shares on an exchange at the Market price, which may be different than the Return is the price at which an exchange-traded fund (ETF) may be bought or sold.
9 The price listed may or may not be the same as the fund's fund's performance is compared with that of an Index . The Index is an unmanaged portfolio of specified securities and the Index does not reflect any initial or ongoing expenses. The Index cannot be invested in directly. A fund's portfolio may differ significantly from the securities in the Index . Returns for periods prior to share class inception represent extended performance returns from an older share class or composite and have been linked to actual share class performance. The performance history is adjusted to reflect any differences in fees between the share classes. Additionally, since inception performance is based on the inception of the Annual Operating ExpenseThis is the percentage of fund assets paid for operating expenses and management fees. The expense ratio typically includes the following types of fees: accounting, administrator, advisor, auditor, board of directors, custodial, distribution (12b-1), legal, organizational, professional, registration, shareholder reporting, sub-advisor, and transfer agency.
10 The expense ratio does not reflect the fund's brokerage costs or any investor sales charges. In contrast to the net expense ratio, the gross expense ratio does not reflect any fee waivers in effect during the time period. Also known as the Prospectus Gross Expense Ratio, Morningstar pulls the prospectus gross expense ratio from the fund's most recent prospectus. Prospectus expense ratios reflect material changes to the expense structure for the current FeesAlso known as loads, sales fees list the maximum level of initial (front-end) and deferred (back-end) sales charges imposed by a fund. The scales of minimum and maximum charges are taken from a fund's prospectus. Because fees change frequently and are sometimes waived, it is wise to examine the fund's prospectus carefully for specific information before RisksThe specific risks associated with investing in this fund. Please see the Risk Definitions document for more information on each type of Disclosures