Transcription of Productivity in scrap and waste materials processing
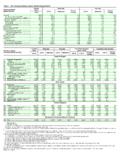
1 Productivity in scrap and waste materials processing Higher capacity machinery, growing demand, and industry consolidation spurred gains in output per hour of all persons over the 1977-87 period Mark Scott Sieling C hanges in demand and output, processing machinery, and industry structure helped spur long-term Productivity gains in the scrap and waste materials industry. A Bureau of Labor Statistics new measure of industry pro- ductivity shows that output per hour of all per- sons in the industry increased at an average an- nual rate of 3 .O percent between 1977 and 1987, identical to the rate for all manufacturing indus- tries combined. 1 The all person hours index de- clined percent a year, while output in- creased percent. (See table 1.) The demand for processed scrap and waste materials increased over the 1977-87 period due to growing exports and changes in steel and paper manufacturing processes, while increased recycling efforts made more unprocessed scrap and waste materials available.
2 The installation of higher capacity processing equipment and a reduction in the number of marginal processing establishments (typically small-size firms) also spurred Productivity gains over the period, es- pecially since the early 1980 s. Mark Scott Sieling is an economist in the Division of Industry Productivity Studies. Bureau of Labor Average annual Productivity gains varied considerably over shorter periods. For example, from 1977 to 1980, output per hour of all per- sons increased at an average annual rate of percent, with output increasing faster than all nerson nercent. CornDared with brcent. These trends, however,&were reversed during the 1980-82 period, when output per hour of all persons declined percent a year, statistics. as output declined faster than hours and employ- ment. Between 1980 and 1982, output fell by about one-fifth, as domestic and foreign de- mand shrank, while hours and employment each declined by about one-sixth.
3 Since 1982, improvements in processing technologies and machinery as well as contin- ued strong demand for scrap metal and waste - paper contributed to above-average Productivity gains. Over the 1982-87 period, output per hour of all persons increased by an average percent per year, compared with a ~percent annual in- for all manufacturing combined. Output increased percent per year, over- shadowing average annual increases in hours ( percent) and employment ( percent). Year-to-year Productivity changes reflected swings in demand, output, and other factors. For example, between 1982 and 1983, output per hour of all persons increased percent. Output increased by 14 percent, reflecting strong foreign and domestic demand, while hours and employment declined because a large number of small-size establishments left the in- dustry (primarily as a result of the 1981-82 re- cession).
4 * In contrast, output per hour declined percent between 1978 and 1979, as output, hours, and employment all increased by about 10 percent. Output and demand The scrap and waste materials industry proc- esses a variety of materials , from scrap copper and gold to rags and fur cuttings. However, 30 Monthly Labor Review April 1990 Table 1. Productivity and related indexes in the scrap and waste materials industry, 1977-07 [1977=100] output Year 1977 .. 1970 .. 1980 .. 1981 .. 1982 .. 1983 .. 1984 .. ii:: 1985 .. 1986 .. 28" Averaga annual ratw of change (in percent) 1982-87 197747 ferrous scrap metal and wastepaper represent the bulk of the industry s output. In 1982, fer- rous scrap tonnage accounted for about nine- tenths of total metal scrap processed by the in- dustry, while wastepaper tonnage accounted for about three-fourths of total nonmetallic Scrupferrous metal processors and dealers col- lect scrap such as junked autos, old equipment, steel from obsolete buildings, and waste from metalworking industries.
5 They sort this obso- lete scrap into one of more than 80 separate scrap metal grades, then process it into forms usable by steel manufacturers and Obsolete scrap is a primary feedstock for iron and steel manufacturing and foundry opera- tions, along with pig iron, directly reduced iron ore, and home scrap - scrap generated by steel and iron manufacturing operations and metalworking industries. A number of factors influence the demand for, and output of, obsolete ferrous scrap . Tra- ditionally, demand has closely reflected the level of domestic and foreign steel and iron But recent changes in steel- making technology have partially broken that bond. Between 1977 and 1987, shifts and changes in steel manufacturing techniques, such as the increased use of electric arc furnaces which pri- marily use scrap as a feedstock, spurred demand for processed obsolete Although the pro- duction of primary iron and steel fell by about one-third over this period, domestic consump- tion of obsolete scrap increased from 38 million tons to 42 million Reductions in the production of home scrap also influenced the demand for obsolete scrap .
6 Because of improvements in steel manufactur- ing, such as continuous casting and improved metalworking technologies, as well as the clos- ing of older, less efficient steel mills which tra- ditionally produced large amounts of home scrap , the output of home scrap fell from just under 50 million tons in 1977 to 25 million tons in This 50-percent reduction in the pro- duction of home scrap , combined with the in- creasing use of scrap in basic iron and steel manufacturing, led to greater demand for obso- lete scrap . Although the output of obsolete ferrous scrap increased over the 1977-87 period, the industry still maintained a processing capacity far in ex- cess of demand. For example, in 1984, the in- dustry s processing capacity was 130 million tons: it actually produced about 49 million tons9 This gap between capacity and actual production partially reflects demand factors and the indus- try s traditional one-shift-per-day operations.
7 Lo While overall output of obsolete scrap in- creased between 1977 and 1987, there were sig- nificant regional variations. Generally, output of ferrous scrap in the Great Lakes, Midwest, and Northeast regions declined, as steel mills closed. Output increased in the South, South- west, and West, largely attributable to the growth of minimills which rely heavily on scrap as their primary feedstock. r It should be noted that most scrap processors are in close proximity to their customers, mainly because of transporta- tion costs. l2 However, long distance trade among States, regions, and countries does occur, and in some cases, increases in foreign demand have compensated for declining local demand. In addition to the increase in domestic con- sumption of obsolete scrap , foreign consump- tion of ferrous scrap rose significantly between 1977 and 1987.
8 In 1977, exports to- taled million tons or about one-eighth of total obsolete scrap produced; by 1987, exports had grown to million tons, representing one-fifth of total Regardless of the changes in basic steel man- ufacturing technologies that have influenced the long-term demand for obsolete ferrous scrap , year-to-year changes in domestic steel produc- tion still strongly affect the output of obsolete scrap . Between 1986 and 1987, both raw steel and obsolete scrap production increased by 8 percent; between 1981 and 1982, domestic ship- ments of obsolete scrap dropped 31 percent, Monthly Labor Review April 1990 31 Productivity in scrap processing primarily reflecting a 38-percent decline in steel production. Wastepaper processors collect various types of used paper products such as newspapers, busi- ness and computer paper, and corrugated boxes.
9 They sort them into one of 70 separate grades, then bundle them for use by paper mills and building supply manufacturers. Between 1977 and 1987, the annual domestic consumption of wastepaper increased from 15 million tons to 20 million tons; exports more than doubled from million tons to million tons. Foreign consumption of ferrous scrap rose significantly between I977 and 1987. About one-third of the approximately 600 paper and pulp mills in the United States use processed wastepaper products as their primary feedstock. In an additional 300 mills, recycled fibers account for 15 percent to 25 percent of the (It should be noted that large inte- grated paper mills usually cannot substitute wastepaper for woodpulp in the manufacturing process. Is) During the 1977-87 period, corrugated scrap annually accounted for between two-fifths and one-half of total wastepaper output; newspaper and mixed grade waste each accounted for about one-sixth; and high grade de-inked and pulp substitutes, such as brown paper bags and com- puter and ledger paper, for In most cases, the proportion of processed wastepaper used in manufacturing various paper products increased significantly between 1977 and 1987.
10 In 1977, wastepaper feedstocks accounted for just over 15 percent of total newspaper produc- tion; by 1986, the proportion had risen to 27 percent. A similar increase was recorded for tissue paper, which used just over 40 percent wastepaper feedstock in 1987, compared with 28 percent in 1977. Manufacturers of kraft paperboard, however, only moderately increased their use of wastepaper feedstocks, from per- cent to Because there is some substitution between woodpulp and wastepaper, yearly demand for wastepaper does not always exactly match the output of paper products. During the 1981-82 period, some domestic paper manufacturers substituted wastepaper for woodpulp as a feed- stock because of price differentials, even though overall paper production declined by about 4 percent. Woodpulp consumption declined about 7 percent during this period, while consumption of wastepaper products fell only 3 percent.