Transcription of Strategic Analytics for Improvement and Learning (SAIL)
1 Strategic Analytics for Improvement and Learning (SAIL) What is SAIL? SAIL, the Strategic Analytics for Improvement and Learning Value Model, is a web-based, balanced scorecard model that the Department of Veterans Affairs (VA) is developing to measure, evaluate, and benchmark quality and efficiency at medical centers. SAIL is designed to offer high-level views of health care quality and efficiency, enabling executives and managers to examine a wide breadth of existing VA measures. The underlying data on which SAIL is based are identical to those available through other Veterans Health Administration (VHA) sources at VA Hospital Compare Performance Since 2012 Atlanta has consistently improved in the following measures.
2 Length of stay Acute Care Standardized Mortality Rate - In Hospital (SMR) Acute Care 30-day Standardized Mortality Rate (SMR30) In-hospital Complications Health Care Associated Infections (HAI) RN Turnover Mental Health and Specialty Care Wait Times Congestive Heart Failure Risk Standardized Mortality Rate (CHF-RSMR ) Congestive Heart Failure Risk Standardized Readmission Rate (CHF-RSRR ) Acute Myocardial Infarction (Heart Attack) Risk Standardized Readmission Rate (AMI-RSRR ) Why did VA develop and deploy SAIL? VA designed SAIL for internal benchmarking within VHA, to spotlight the successful strategies of VA s top performers in order to promote high quality, safety, and value-based health care across all of its medical centers.
3 While other measurement models in VA and the private sector assess and score health care facility performance, SAIL encompasses many more metrics and offers custom views of information to help VA users pinpoint strengths and opportunities for Improvement . As SAIL s name indicates, it is oriented to support Improvement and Learning ; this is consistent with VHA s vision of Learning , discovery and continuous Improvement . What exactly does SAIL measure and how? SAIL divides VA s 128 acute inpatient medical and/or surgical care VAMCs into four comparison groups based on VA standards for hospital complexity level and intensive care unit level. SAIL assesses Quality measures in areas such as mortality, complications, and customer satisfaction, which are organized within eight domains.
4 In addition, SAIL includes another measure to assess overall Efficiency (the Efficiency domain). SAIL draws data from existing measures prepared by VHA Program Offices and VA national databases for inpatient and outpatient care and facility characteristics. From these measures, SAIL also provides a composite 1 to 5 star rating for each of the 128 VAMCs in overall Quality. What exactly does SAIL measure and how? The assessment of the relative performance of facilities takes several steps: Facilities are first compared within their comparison group on individual Quality measures and assigned a score based on their relative performance. Within each domain, the measure scores are multiplied by the assigned weight and then added together to become the domain score.
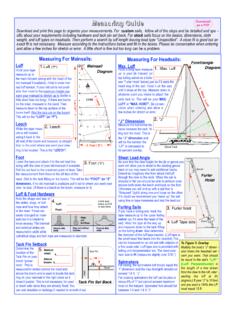
5 The domain scores are then used to calculate the Quality composite score. Using 10th, 30th, 70th, 90th percentile cut-offs of the composite scores, each facility is designated a 1 to 5-Star rating for overall Quality. What does it mean if a VA facility has only one star Quality? Or five? SAIL s prototype 5-star rating system for VA Medical Center Quality is structured so that, at any given time, there is always a bottom 10 percent of VAMCs that will have a 1-star rating, a top 10 percent with 5 stars, and a middle 40 percent with 3 stars. 1 Star 2 Star 3 Star 4 Star 5 Star 0 10 30 70 90 100 Percentile distribution of score How many VA Medical Centers (VAMC) are included in the SAIL database?
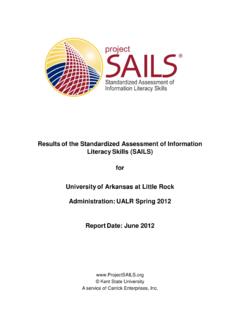
6 Currently, VA has 150 operating VAMCs. SAIL scores, ranks and assigns overall Quality and Efficiency Star ratings for the 128 VAMCs that provide acute inpatient medical and/or surgical care to Veteran patients. These 128 VAMCs include divisions which are combined with the main VAMCs within the same health care system. SAIL contains data from Fiscal Year 2010 to roughly one quarter before the current fiscal year quarter. What period of time does SAIL cover? Performance Since 2012 Atlanta has consistently improved in the following measures: Length of stay Acute Care Standardized Mortality Rate (SMR) Acute Care 30-day Standardized Mortality Rate SMR30 In-hospital Complications Health Care Associated Infections (HAI) RN Turnover Mental Health and Specialty Care Wait Times Congestive Heart Failure Risk Standardized Mortality Rate (CHF-RSMR ) Congestive Heart Failure Risk Standardized Readmission Rate (CHF-RSRR ) Acute Myocardial Infarction Risk Standardized Readmission Rate (AMI-RSRR ) Domain Performance Comparison FY14Q1 FY14Q2 Marker color: Blue-1st quintile; Green-2nd; Yellow-3rd; Orange-4th; Red-5th quintile Marker color: Blue-1st quintile; Green-2nd.
7 Yellow-3rd; Orange-4th; Red-5th quintile Metric Performance Comparison FY14Q1 FY14Q2 One Tw o Three Four Five RSRR-AMI RSRR-Pneumonia HEDIS Patient Satisfaction Primary Care Wait Time SMR-30 RN Turnover RSRR-CHF Patient Safety Indicator Best Places to Wo r k HC Assoc. Infections Specialty Care Wait Time RSMR-Pneumonia Call Responsiveness Mental Health Wait Time SMR Efficiency RSMR-CHF Oryx Complications Adjusted LOS ACSC Hospitalization Quintile Rating (One = Top 20%; Five = Bottom 20%) DESIRED DIRECTION =>SMRSMRSMR3 0 SMR3 0 NOTEQ uintiles are derived from facility ranking on z-score of a metric among 128 facilities. Lower quintile is more IPS IRN- Tur nRN TurnoverSCA c c esAccess to Specialty CarePCA c c e sAccess to Primary CarePNEU- MRRSMR-PneumoniaPNEU- RRRSRR-PneumoniaInpQualInp Quality MeasuresMHA c c e sAccess to Mental HealthPatSatPt Satisf actionHEDISHEDISHos A CSCACSC HospitalizationInf ectHC Assoc Inf ectionsComplicComplicationsEff-SFAEf f iciency (1/SFA)
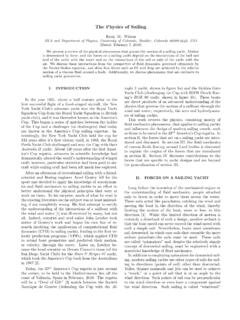
8 EmpSatEmployee Satisf actionCallResCall ResponsivenessCHF- MRRSMR- CHFCHF- RRRSRR- CHFAtla ntaMEASURESDESIRED DIRECTION =>AdjLOSA djusted LOSA MI- RRRSRR- A MIHeart Failure Care Measures Atlanta VAMC Georgia Average National Average Data Collected From To Heart failure patients given discharge instructions 98% 92% 94% 10/1/2012 9/30/2013 Heart failure patients given an evaluation of left ventricular systolic (LVS) function 100% 99% 99% 10/1/2012 9/30/2013 Heart failure patients given ACE inhibitor or ARB for left ventricular systolic dysfunction (LVSD) 93% 97% 97% 10/1/2012 9/30/2013 Effective Heart Failure Care Effective Heart Attack Care Measures Atlanta VAMC Georgia Average National Average Data Collected From To Heart attack patients given aspirin at discharge 97% 99% 99% 10/1/2012 9/30/2013 Heart attack patients given a prescription for a statin at discharge 98% 98% 98% 10/1/2012 9/30/2013 Hospital Compare Timely & Effective Care Pneumonia Care Effective Pneumonia Care Higher percentages are better Measures Atlanta VAMC Georgia Average National Average Data Collected From To Pneumonia patients whose initial emergency room blood culture was performed prior to the administration of the first hospital dose of antibiotics 99% 97% 98% 10/1/2012
9 9/30/2013 Pneumonia patients given the most appropriate initial antibiotic(s) 96% 95% 95% 10/1/2012 9/30/2013